Volatility Alert 📉: This week is going to be important!
Volatility Alert 📉: This week is going to be important!
With CPI data to be released this Wednesday, it’s important to look out 👀 for your position, as market might decide a direction soon. This letter brings you the analysis of :
US Dollar (DXY)
Bitcoin
Ethereum
Matic
SNX/USDT : Special Mention

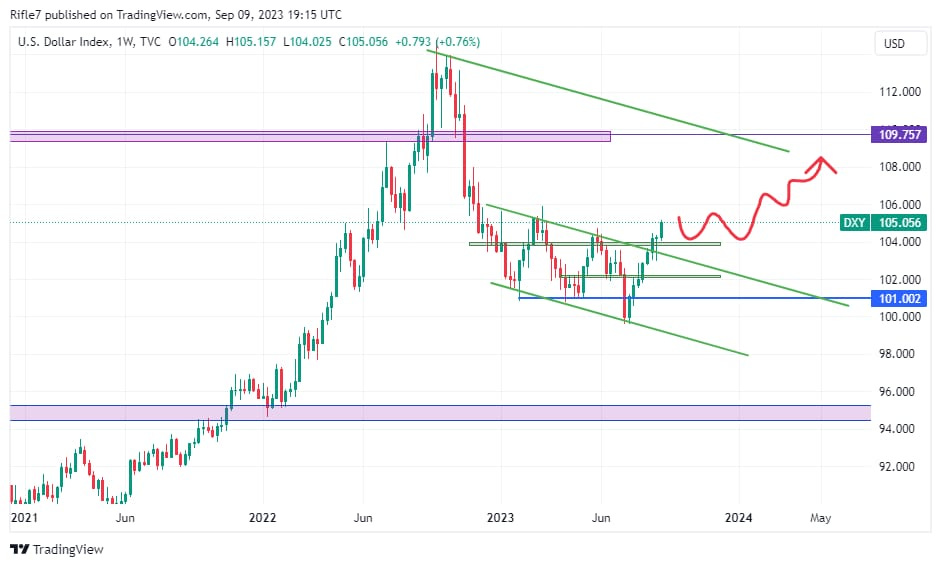
DXY 📈
During the past week, the S&P 500 experienced a 1.3% decline, while the Dow DJI saw a 0.75% decrease, and the Nasdaq IXIC dipped by 1.9%. These movements were largely driven by investor concerns about rising interest rates and a sense of caution ahead of upcoming U.S. inflation data.
On Friday, the U.S. dollar rebounded from earlier losses, primarily due to an increase in T-note yields, which had been predominantly lower throughout the trading session. Additionally, a pessimistic outlook on China's economy contributed to the yuan weakening significantly against the dollar, reaching its lowest point in 15 years.
The economic news released on Friday in the United States painted a bearish picture for the dollar, as consumer credit for July only rose by $10.399 billion, falling short of the expected increase of $16.000 billion.
In the Daily charts 👇 :
The daily support is at 103.813-103.978
The daily resistance is at 105.586-105.892

In the weekly chart 👇:
The weekly support is in the upper trend line of the parallel channel
The weekly resistance is 109.31-109.891

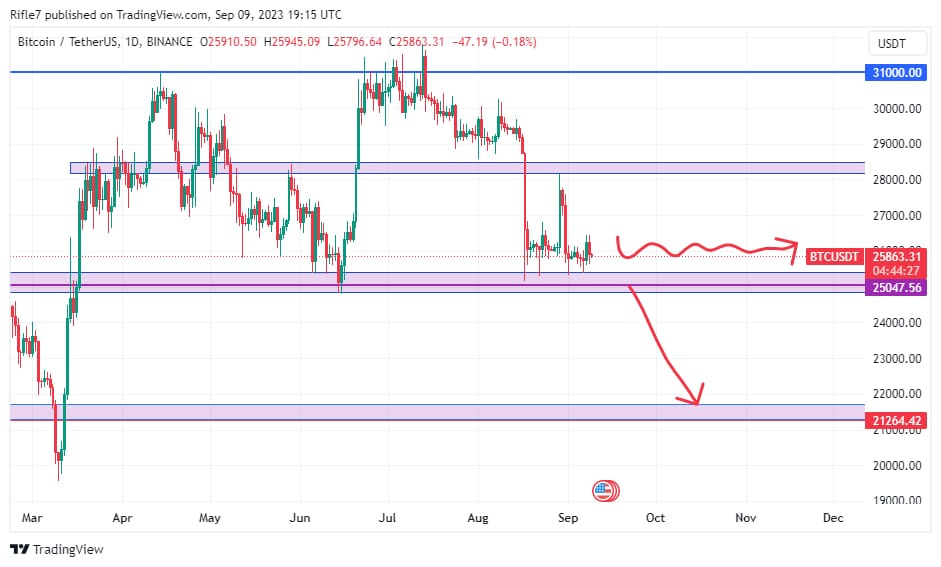
BTC ₿
The price of Bitcoin has retraced to levels seen before the BlackRock announcement. Back on August 29, Bitcoin, the leading cryptocurrency, experienced a significant surge, reaching heights of $28,000, following a favorable development with Grayscale. However, those gains have now been erased due to the decision by the U.S. Securities and Exchange Commission (SEC) to postpone its rulings on seven Spot ETF applications.
As the fate of a Spot Bitcoin ETF approval remains uncertain, Bitcoin might continue to face a downturn throughout the current month. Historical data suggests that September has typically been a bearish period for Bitcoin's price, often concluding in the red.
Daily Chart Analysis :
On daily close below 25k we can go downside till 21.7k, this will only happen if there is a big market crash coming in the stock market(S&P 500)
Until then market continues sideways, along with decline in Open Interest
Daily support: 24.8-25.8
Daily resistance: 28.1-28.4
In the Weekly Charts :
Bearish Double Top Formation confirmed once 25k is broken
The support remains same as the daily chart


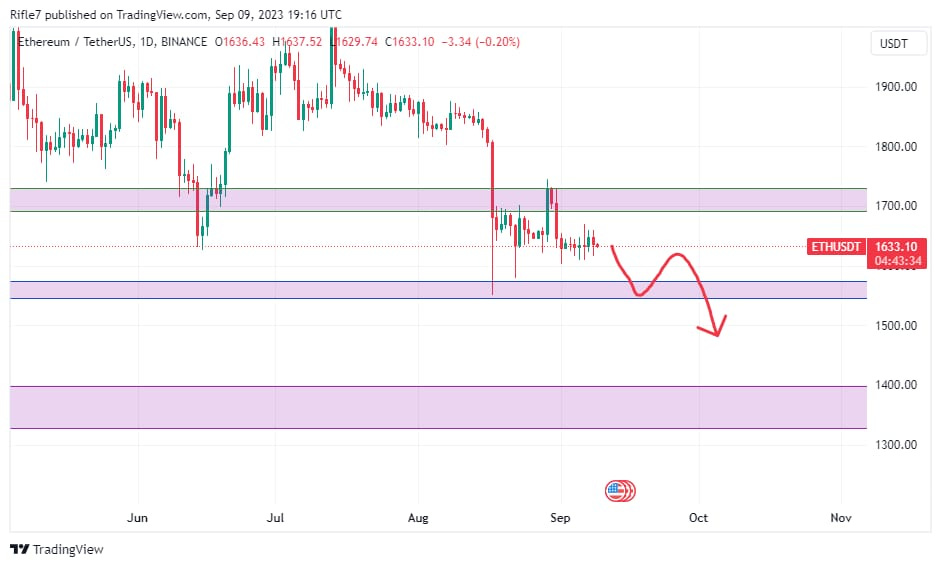
ETH ♢
Ethereum's price appears to have once again succumbed to the prevailing market sentiment, despite a somewhat favorable week. On September 6th, Ark Invest made a notable move by filing for the first Ethereum spot exchange-traded fund (ETF) in the United States.
Surprisingly, this ETF application had a rather muted effect on the price of Ether, with the cryptocurrency experiencing only a modest increase to $1,650 the following day. Furthermore, it's worth noting that Ether has nearly completely retraced the slight gains it initially made in response to this significant development.
Daily Chart Analysis :
The daily support 1546-1571 is most like to break.
The daily resistance is 1691-1730.
In Weekly time frame, ETH is following the foot of BTC and hasn’t shown any significant moves this.


MATIC ♾️
In the news : Earlier last week, on September 7, 2023, Mirae Asset Securities, South Korea's largest financial conglomerate managing assets exceeding $500 billion, unveiled its integration with the Polygon network. The objective of this partnership, as detailed in the announcement, is to foster the widespread adoption of Web3 technologies and cultivate a community focused on tokenized securities.
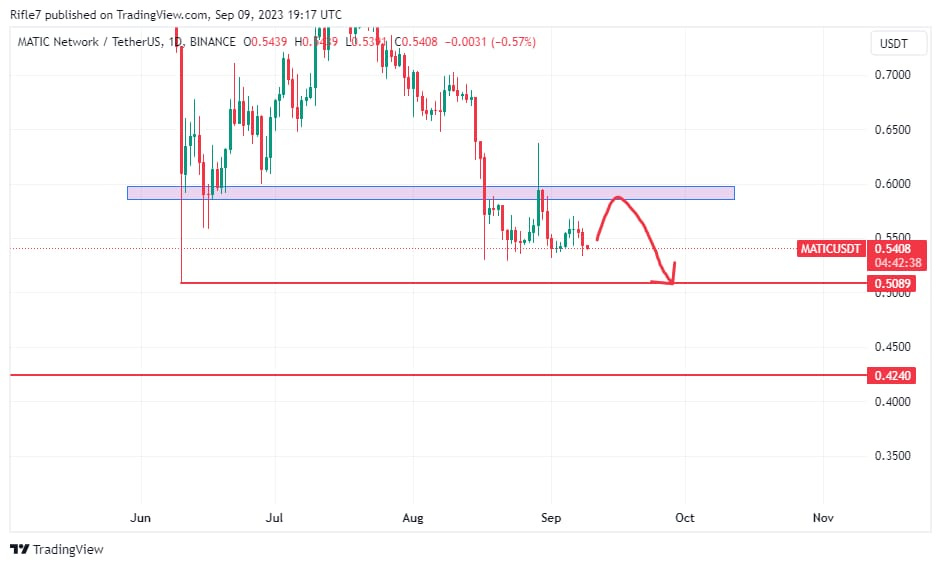
Daily Chart Analysis :
Daily support:0.5089
Daily resistance:0.5856-0.5979
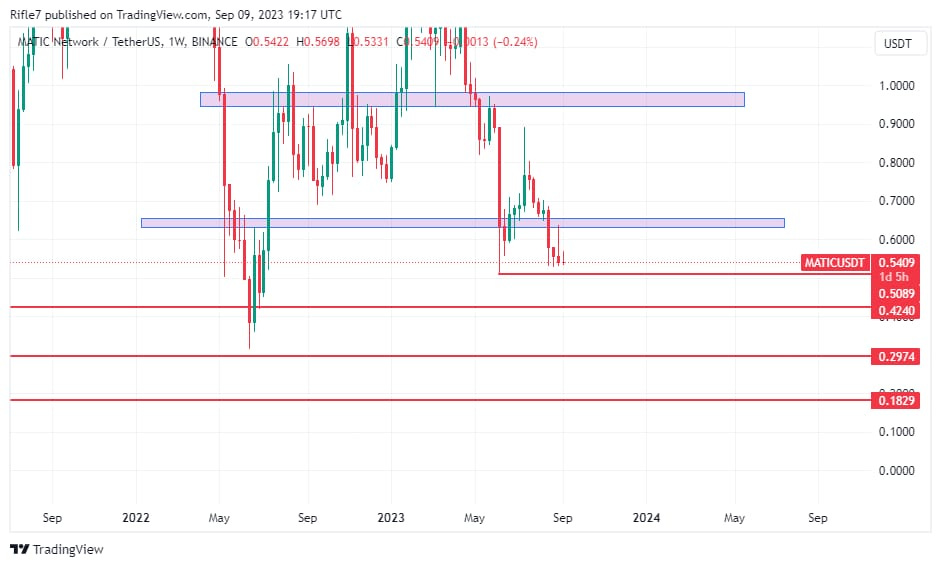
On weekly charts:
Various buying zones or one can say accumulating zones are
0.4240
0.2974
0.1829
Weekly resistance is at:0.656-0.632

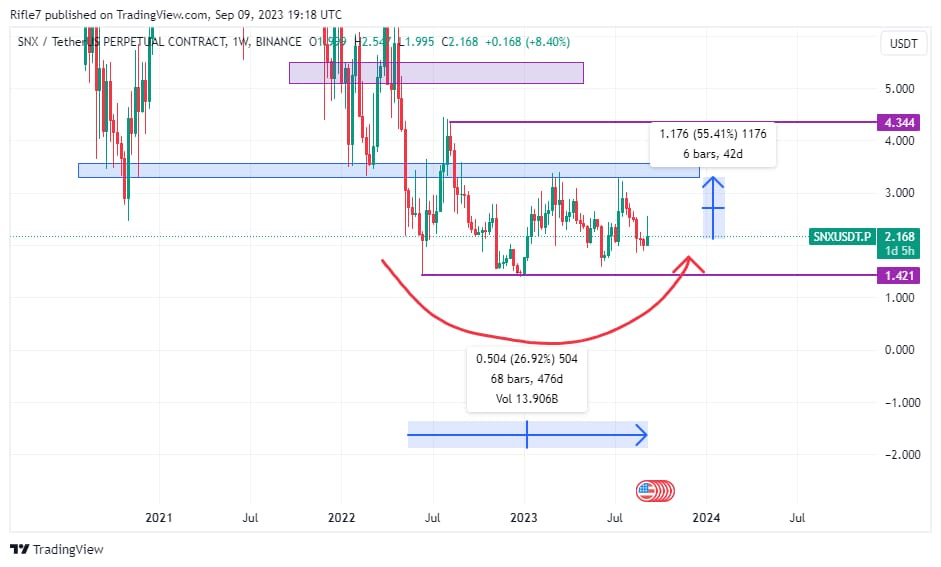
SNX (Keep your 👀 on it)
SNX has absorbed the dump very strongly which occurred on 17th aug and continued its upside move.
Daily Charts are as follows :
Daily support: 2.04-2.22
Daily resistance: 2.778

The weekly time frame looks as follows: