

Top 5 Trading Indicators that will increase your success rates
Top 5 Trading Indicators that will increase your success rates
Step-up your trading with these 5 important indicators.
GM!
This is CryptoCult, the only newsletter obsessed with maximizing your gains!
Today we bring you a list of Top 5 indicators and how to use them.
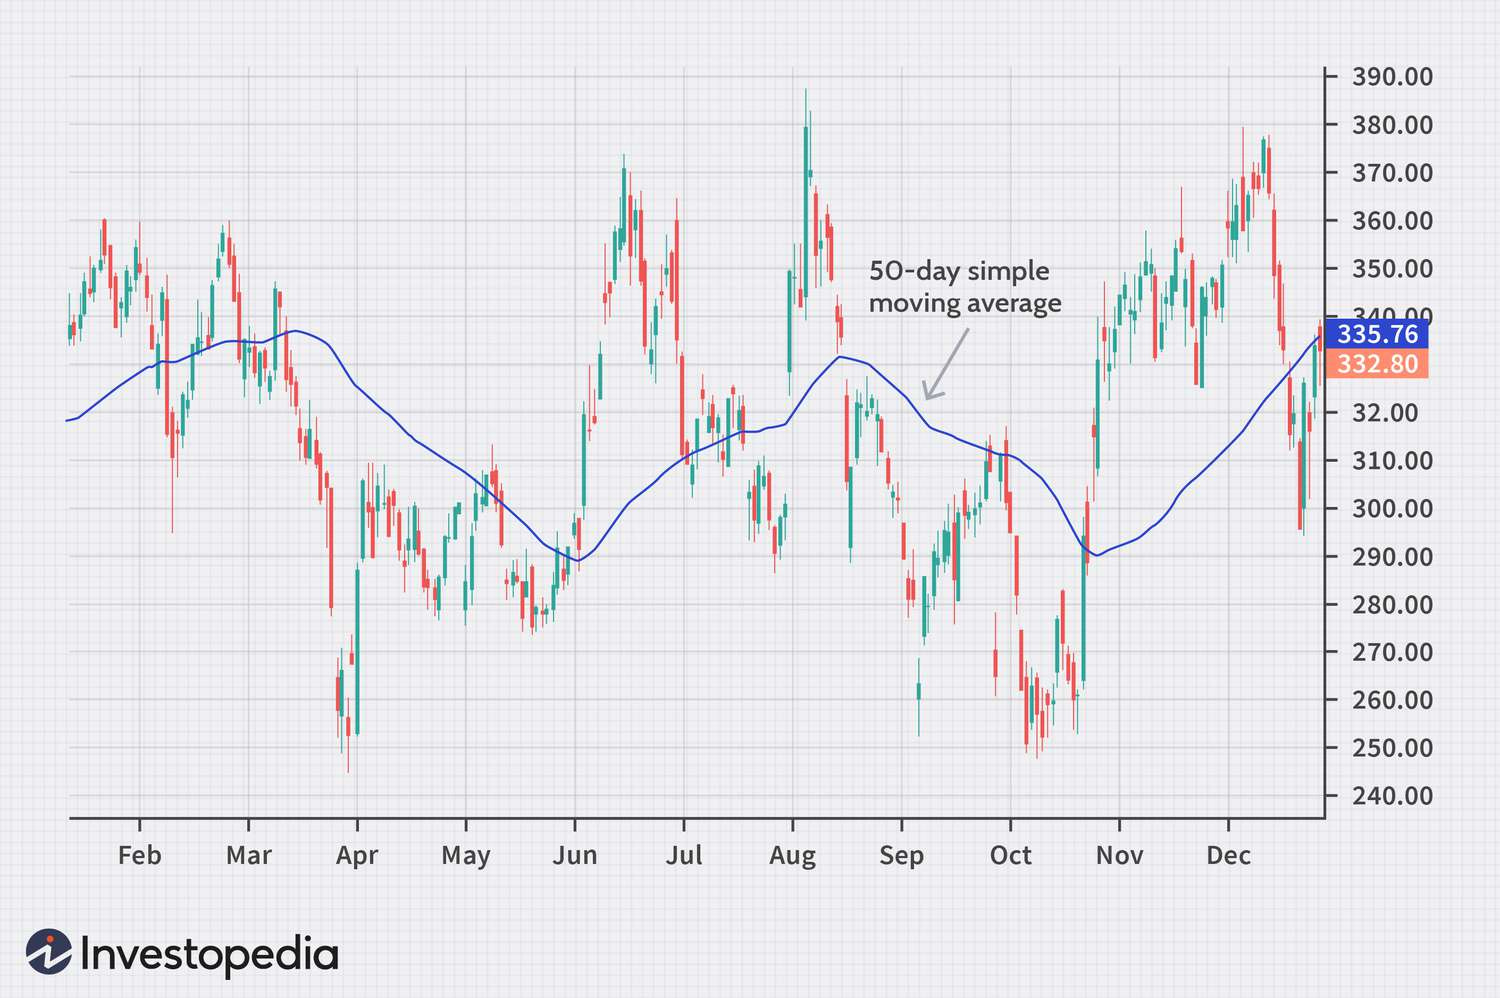
1. Moving Averages 📊
Moving averages (MA) smooth out price action to identify trends. The longer the time period, the slower they react. The type of MA also matters...
Exponential moving averages (EMA) respond faster than simple MAs to price changes. More weight is given to recent data. Try the 50 and 200 EMA combo on the daily chart.
How to use: Spot crossovers between MAs like 50/200 days to identify trend changes. Or look for support/resistance holds. For example, if price holds above the 50MA post a downward crossover, it implies a potential trend reversion.
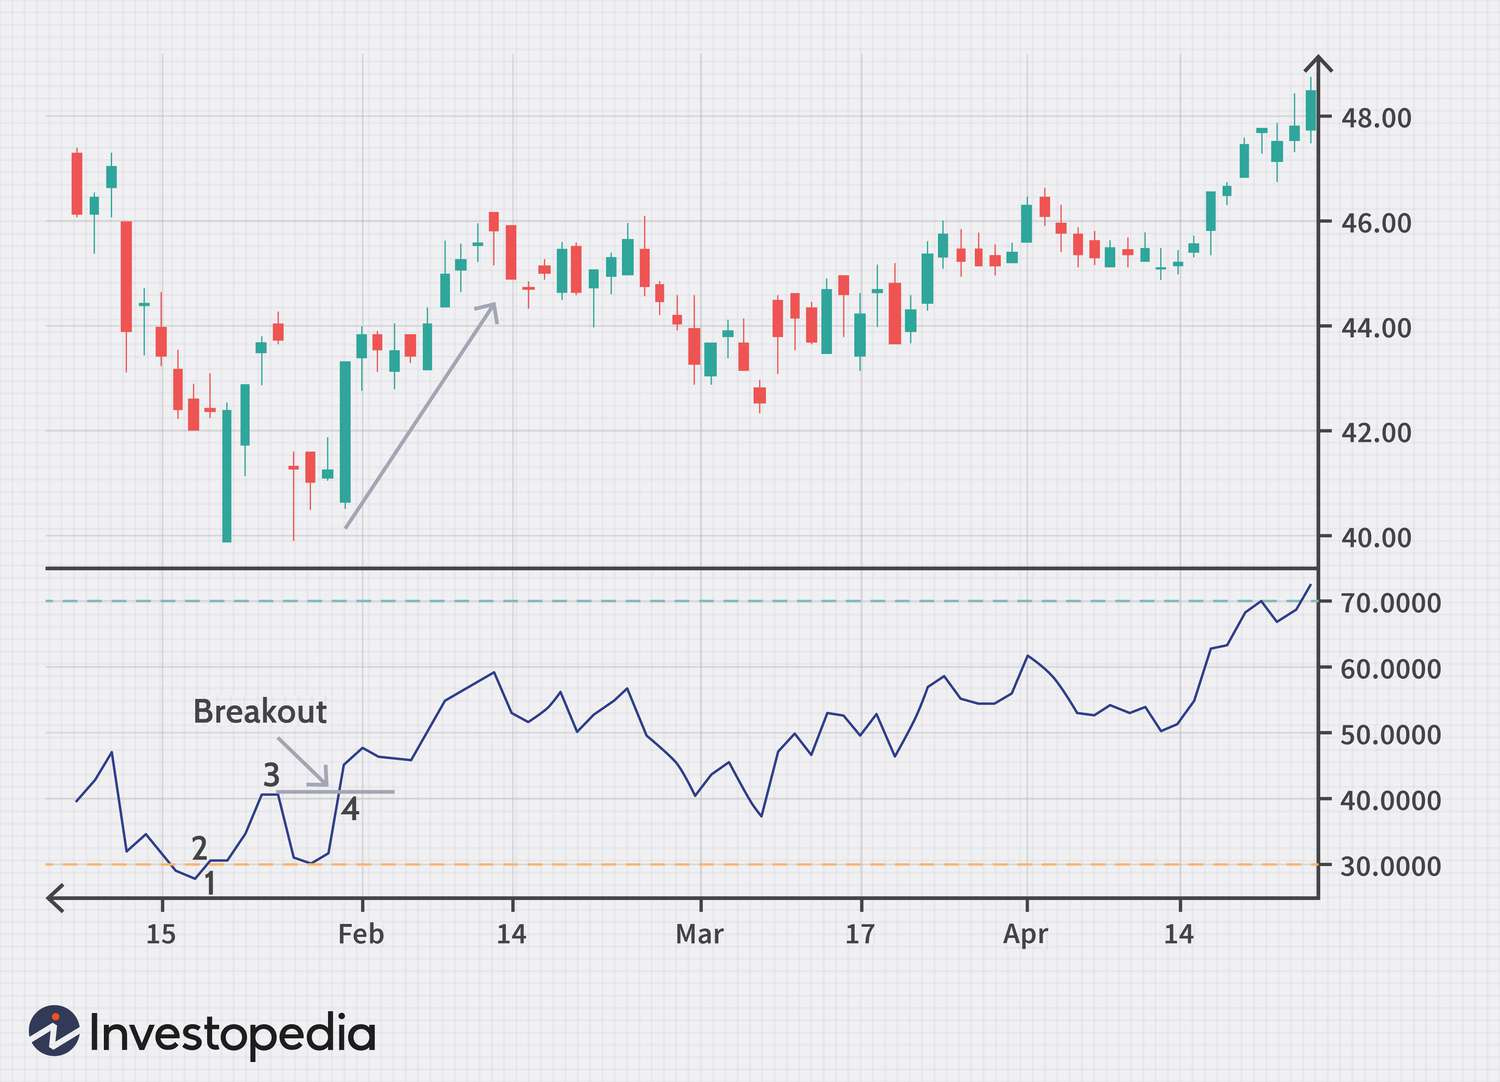
2. RSI 💪
RSI measures the speed and magnitude of price moves. It oscillates between 0 and 100 - over 70 is overbought while under 30 is oversold.
Divergence between RSI and price hints at impending reversals. If RSI is rising but price falls, expect a bounce. The opposite suggests a drop ahead.
How to use: Look for "divergences" between RSI and price for early reversal signals. Enter long on RSI dips below 30 targeting a move back to 50.
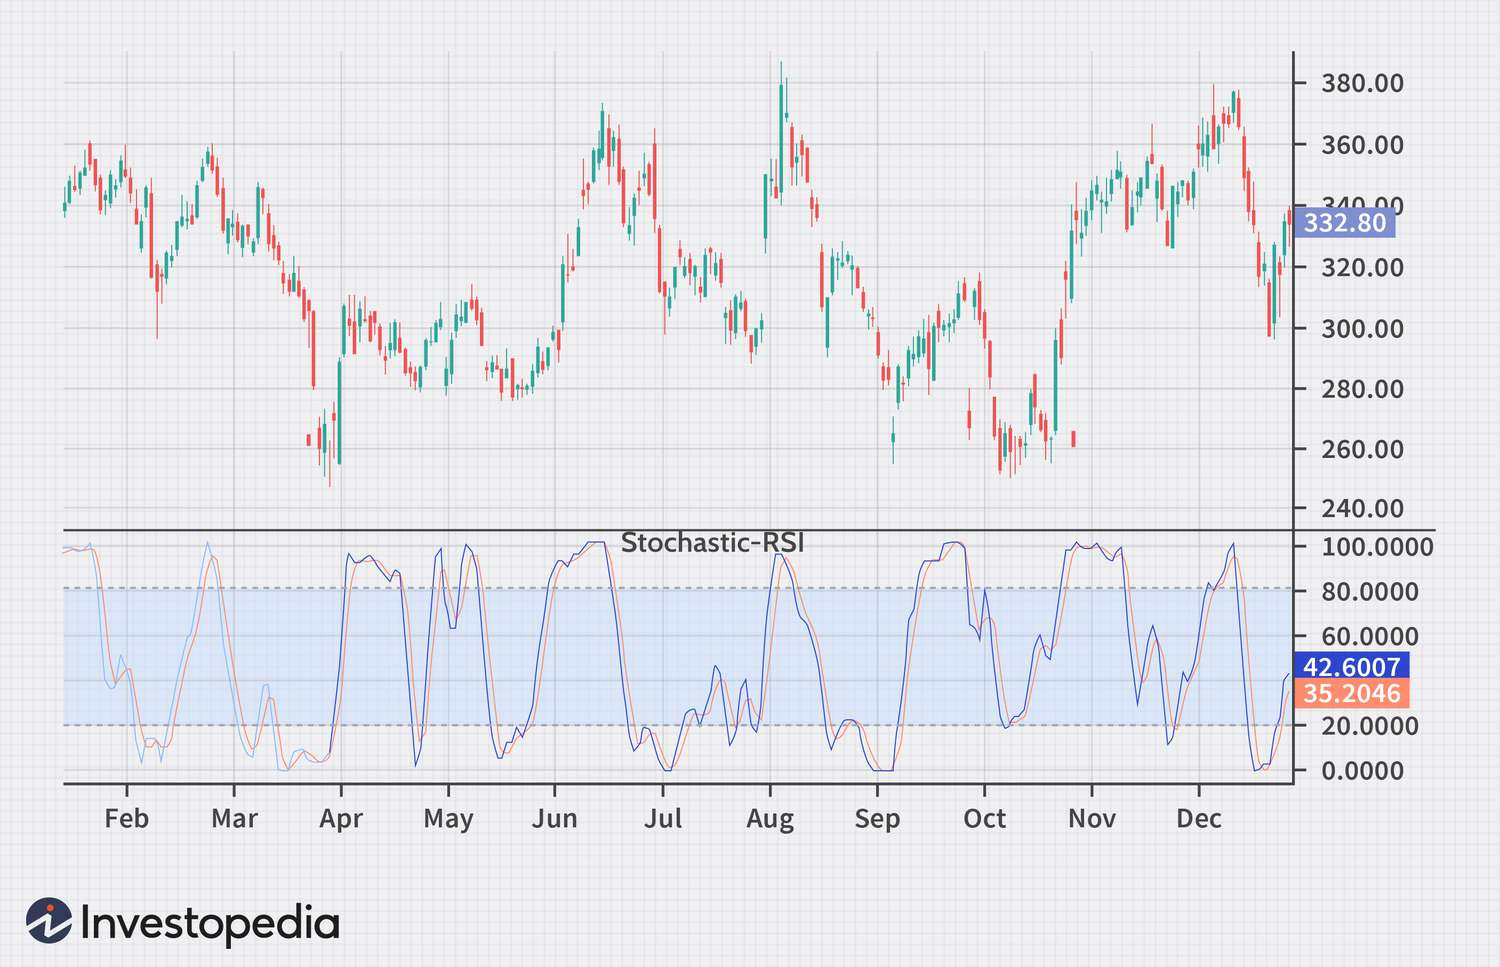
3. Stochastic RSI 🎢
Stochastic RSI combines RSI with the stochastic oscillator. It reveals oversold/overbought levels across different timeframes. Oversold below 20 and overbought above 80.
How to use: Monitor crossovers between the %K and %D lines, and look for %K dips below 20 with subsequent bounces for bullish entry clues. Smoother D lines trigger better entries.
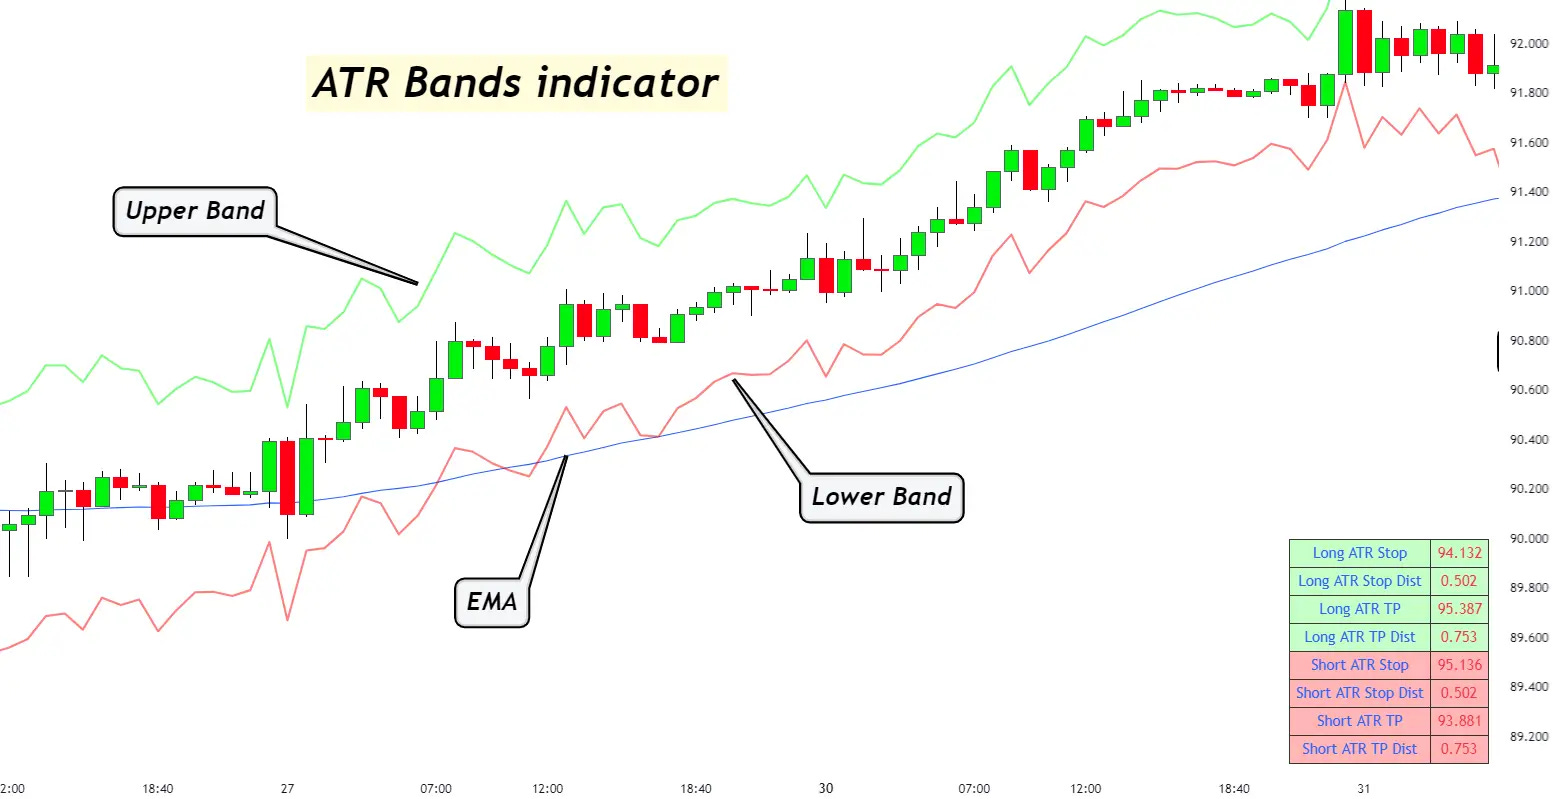
4. Average True Range (ATR) 🎮
ATR quantifies volatility as the average price range over time - often 14 days. It provides sizing guidance for stop losses and profit targets.
Higher ATR = wider stops and targets. Lower ATR = tighter stops/targets. Simple yet powerful for managing risk.
How to use: Set your stop loss a minimum of 1x-2x the recent ATR below your entry price to limit potential losses from volatility.
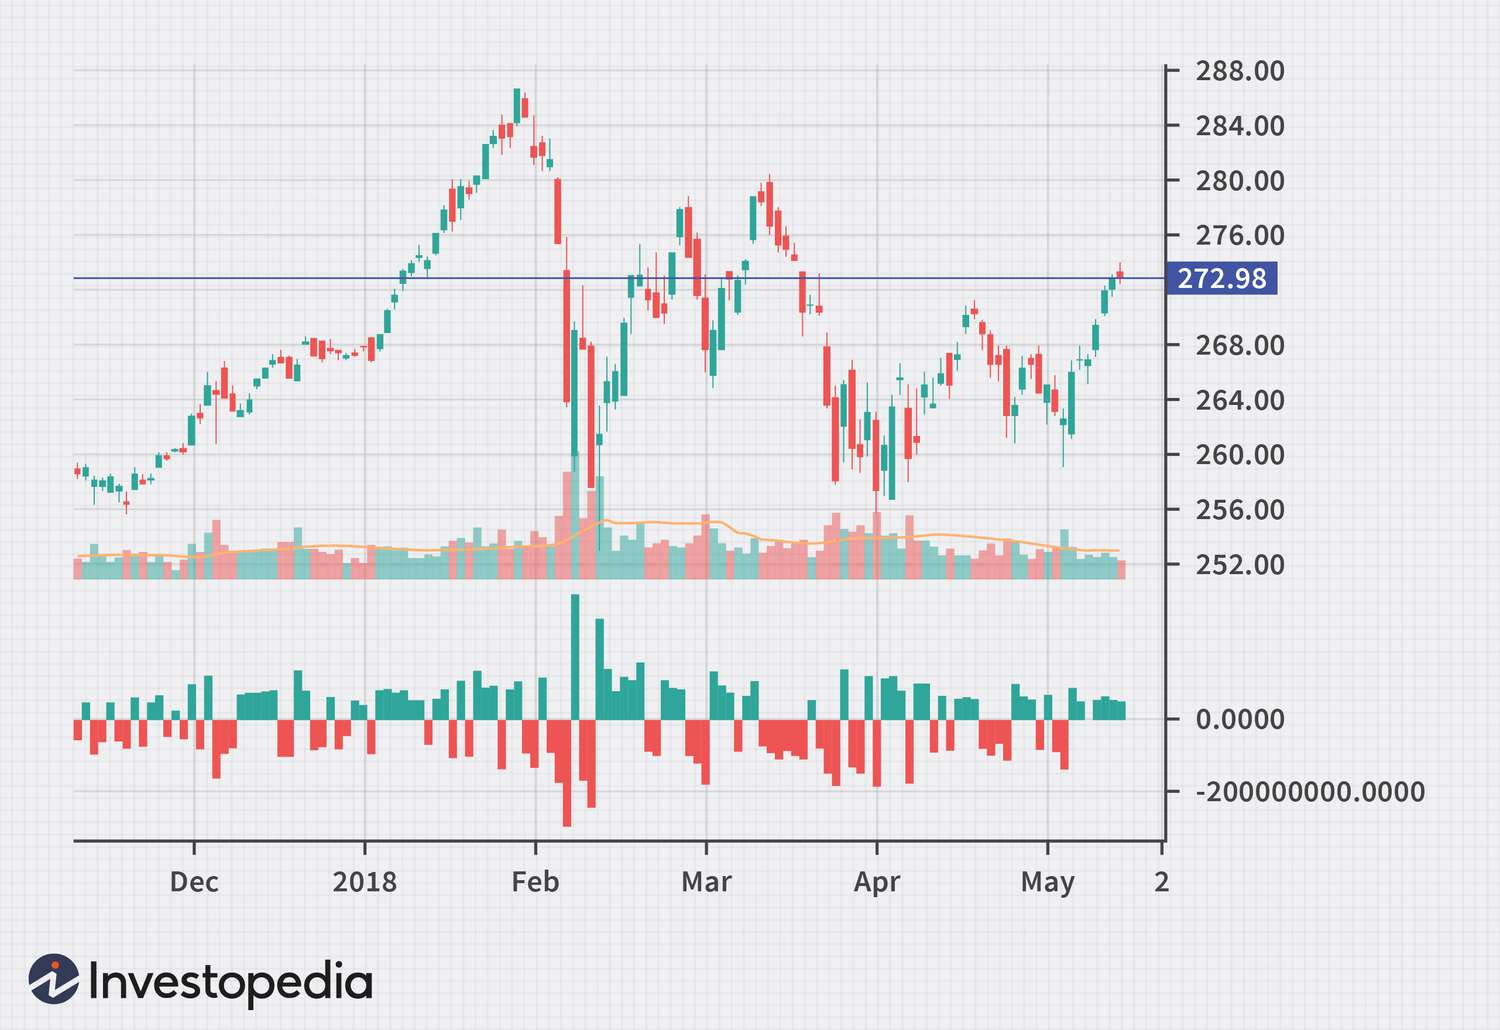
5. Volume 📣
Higher than average volume confirms price breakouts and signals big moves ahead. Volume precedes price. OBV (on balance volume) also gauges momentum.
Low volume rallies often fail - lack of interest. Price and volume must align for trade confirmations. Volume climaxes hint at exhaustion.
How to use: Study volume patterns from previous price swings. Look for heavier volumes during breaks of critical levels for trade confirmation.
There you have 5 indicators to step up your trading. Implement them with proper risk management. Your win rate will rise as you are confident in the use of these indicators.
Until Next Time, CryptoCult Signing Off!