

Navigating the Markets - Dollar, SPX and Crypto Chart Analysis 🚀
Navigating the Markets - Dollar, SPX and Crypto Chart Analysis 🚀
Your Weekly Guide to Strategic Market Moves - August 22, 2023
We wave our hands to our readers! Welcome back to another edition of Crypto Jargon Market Analysis. For all those who have been reading our newsletters lately, thank you! And we are cooking more stuff for you guys, Stay tuned!

Here’s what we have got for you today!
Dollar and American Market Analysis
Some alt coins to keep your eye on.
DXY
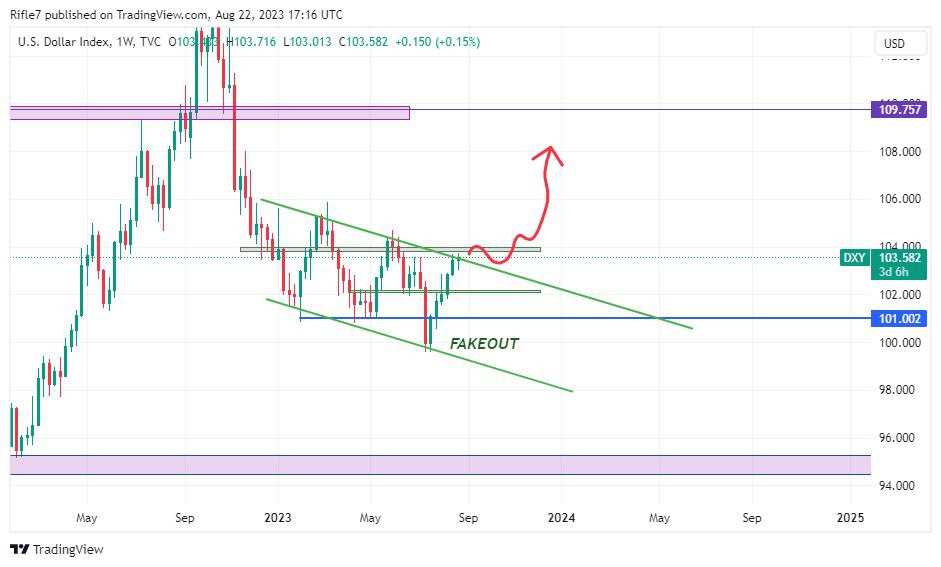
The "safe-haven" Dollar remained strong against major counterparts, while the Yuan declined for the ninth consecutive month. This occurred after China's central bank unexpectedly reduced key policy rates for the second time in three months on Tuesday, in an effort to support the country's struggling economy.

DXY has broken descending triangle in daily chart and confirmed its support, as we reach a crucial junction. We saw downfall in price of stocks and commodities, even in Bitcoin. If it fails to break the triangle, we will see a sideline movement for a while.
DAILY SUPPORT: 102.110-102.193
DAILY RESISTANCE: 103.359-103.559

US Market Insight: SPX in Focus
📊 S&P 500 (SPX) Daily & Weekly Overview
Stocks on Monday settled in a mixed pattern. The strength in blue-chip stocks primarily bolstered the technology sector and the overall market as a whole. However, higher T-note yields on Monday constrained stock gains, compounded by concerns about China's debt crisis.
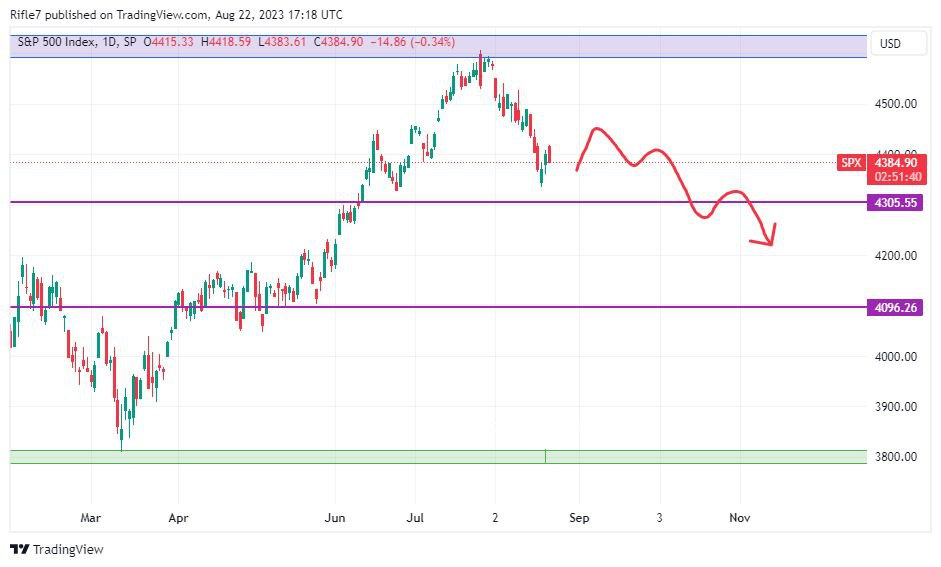
SPX HAS BEEN IN WEEKLY UPTREND SINCE 3RD JAN 2023 reaching its crucial resistance, we can expect it to retrace till the region of 4300 where a reaction is expected before we continue the downtrend.
Weekly support: Region 1: 4305, Region 2: 4096
Weekly resistance: 4591-4636

AMZN
AMZN has reached its 2020 resistance with a strong uptrend since start of the year, the weekly chart is as follows.

DAILY SUPPORT:128.73-131.23
DAILY RESISTANCE:143.55(ALSO THE RESISTANCE OF 2020)
WEEKLY SUPPORT:101.68-106.10

🪙 Crypto Spotlight: Unveiling Opportunities
RUNE
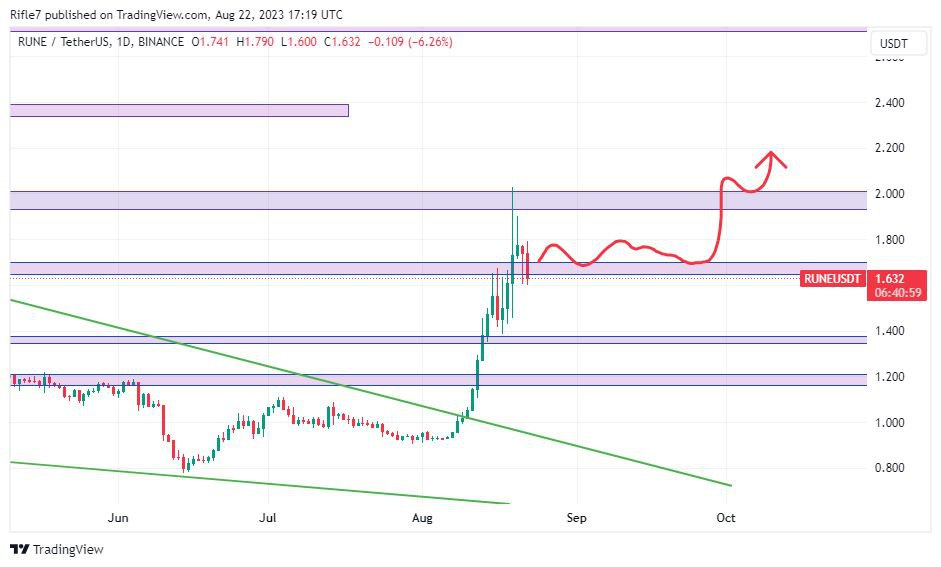
Since a week RUNE has been 60 percent up, expected reaction areas in chart are shown, we expect retracement from the mentioned zones.
WEEKLY RESISTANCE: 1.923-2.012
DAILY SUPPORT: 1.377-1.345
WEEKLY SUPPORT: 1.164-1.208

INJ
INJ has lost its imp support of $8, spiraling into downtrend in daily time frame. Levels are as marked in the chart.
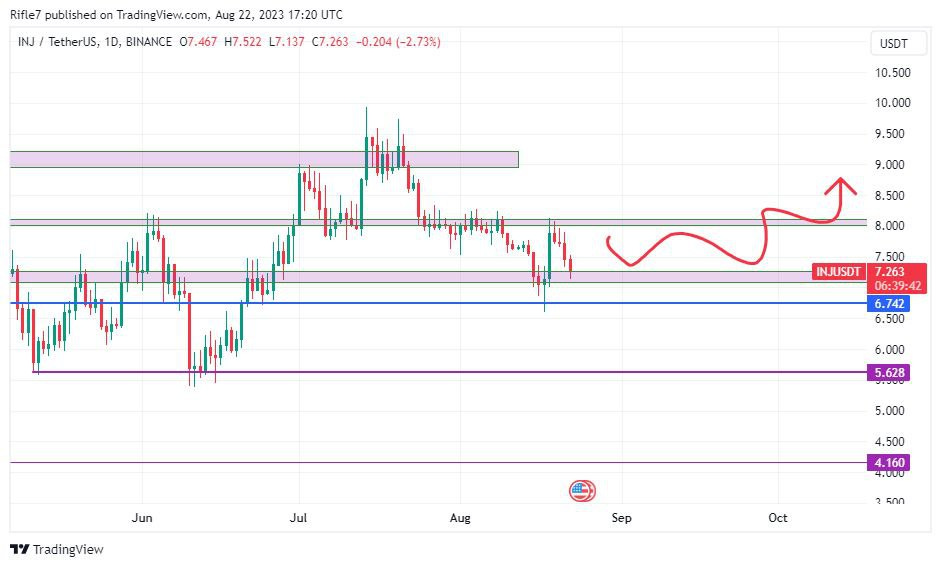
Daily Support:7.029-7.274
Daily Resistance:8.017-8.109
In the weekly chart, we interpret a double top formation.


Stay tuned for our next analysis, as we delve into the evolving landscape of finance and crypto. Until then, trade wisely and ride those waves to success!