

Market in Motion 📈- Here are your trading levels.
Market in Motion 📈- Here are your trading levels.
Watch out for these levels as market prepare for some volatility.
Ahoy Traders 👋!
Yea we know we are a day late for the Market Analysis but better late than never. This weeks market update covers :
Bitcoin
Ethereum
BNB
INJ
India Bulls Housing Finance
BTC Bulletin
The price of Bitcoin is moving higher above the $26,200 resistance level. BTC could gain bullish momentum if there is a daily close above the $26,500 resistance.
Bitcoin is trading above $26,000 and the 100 hourly SMA, showing signs of strength.
There is a bullish trend line forming on the hourly chart with support near $26,050.
A close above $26,500 followed by a move above $27,000 could kickstart a fresh BTC rally.
The daily chart continues to respect our previous support and resistance levels.
Daily Support: $24,800-$25,800
Daily Resistance: $28,100-$28,400
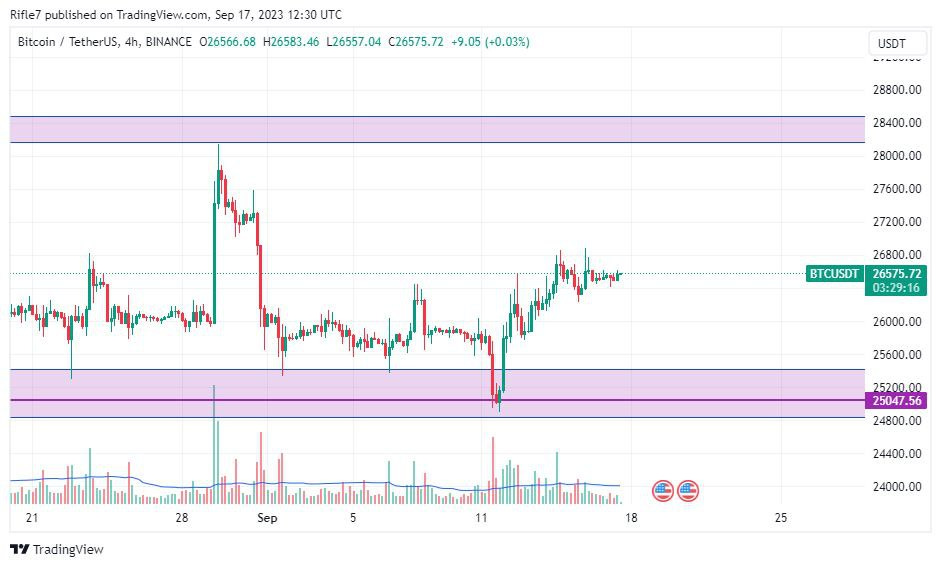
The weekly chart remains in line with previous analysis.
Weekly Support: $25,047
Weekly Resistance: $28,547

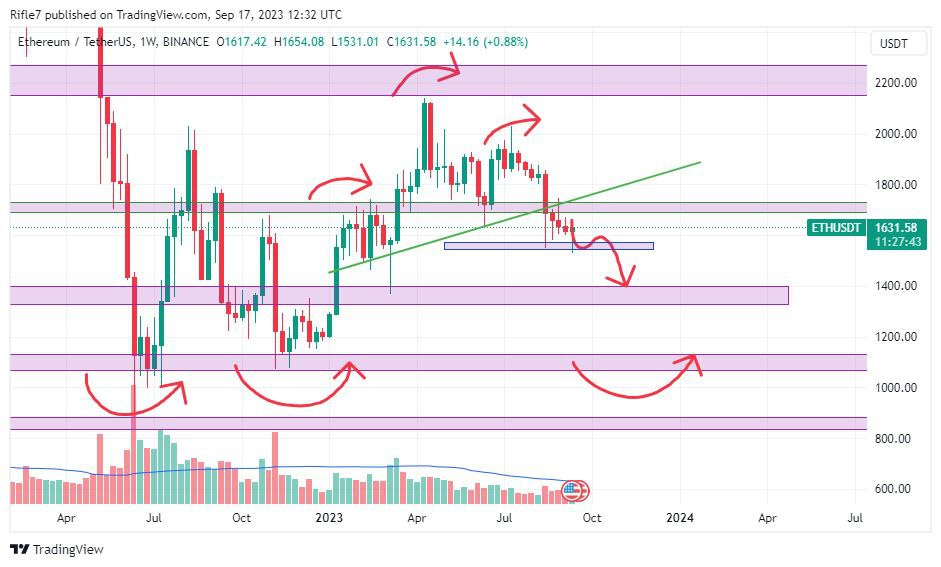
Ethereum Update
On Thursday, analytics firm Santiment revealed Ethereum's daily active addresses hit its second-highest level ever. The last time this metric reached ATH was in December 2021, suggesting a new catalyst driving activity.
ETH’s daily support of $1,546-$1,571 looks prone to break.
Daily resistance sits at $1,691-$1,730.
September has been a historically bearish month for crypto over the past 4 years.
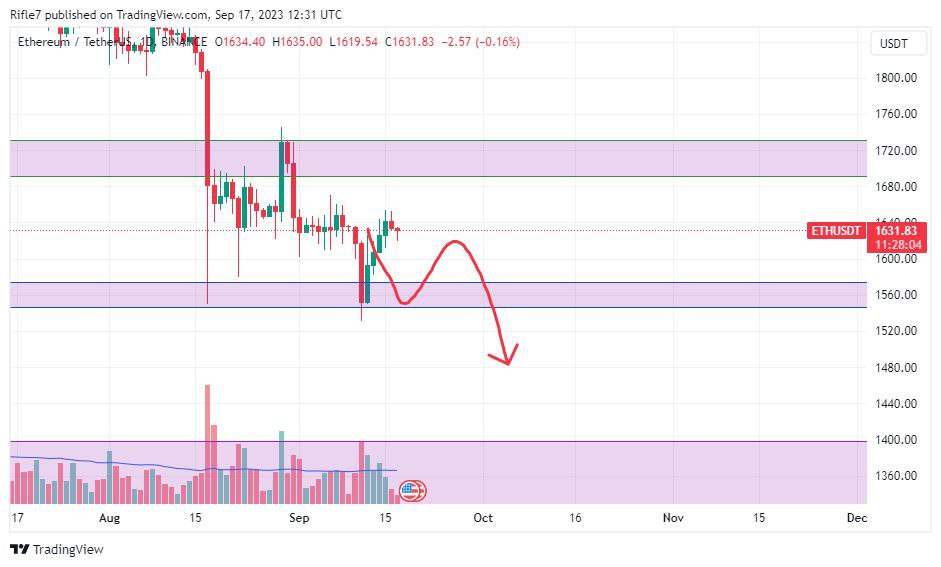
The weekly ETH chart remains unchanged.


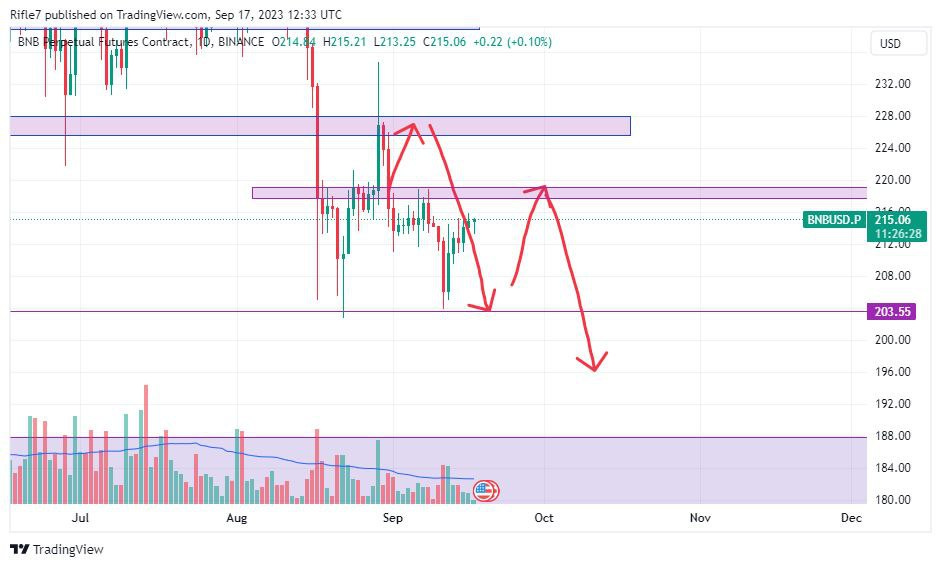
BNB Breakdown
BNB has also respected our previously outlined levels, with the zone of $203-$205 likely to break, sending it towards $187 next.
Resistance:
Zone 1: $217-$219
Zone 2: $225-$227
Support: $203-$205
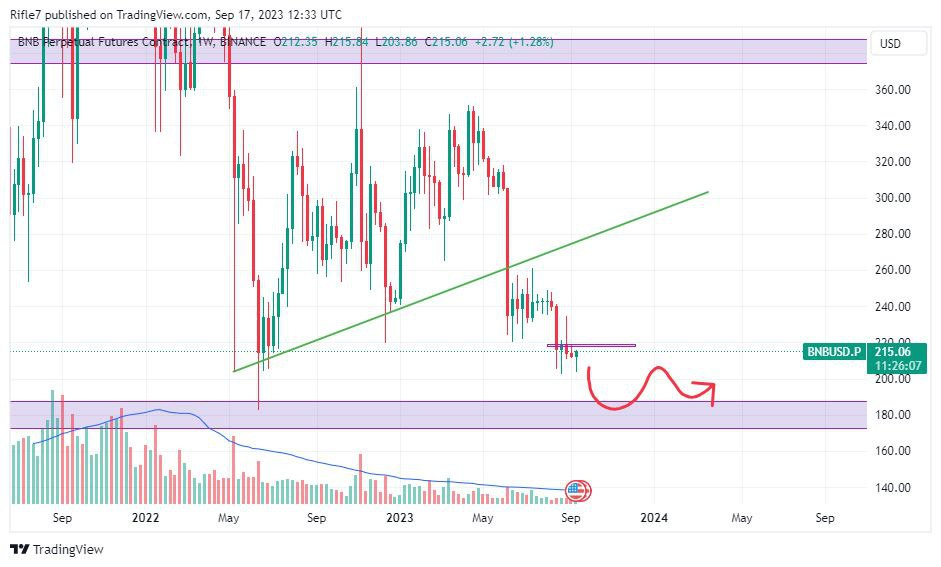
The weekly BNB chart's trendline continues acting as resistance.

INJ Update
The trendline is acting as resistance on INJ's daily chart. No long positions recommended until a breakout occurs.
Daily Resistance: $7.090-$7.272
Daily Support: $5.628

A double top pattern appears to be forming on the weekly INJ chart.

India Bulls Housing Finance
This Indian stock has huge upside potential, possibly a 2x return if the breakout goes right.
The monthly chart shows a triple bottom with the trendline acting as resistance.
Look for a rejection at 216 followed by a retracement to the buying zone of 167-174 or 149.
A squeeze in this zone could signal an imminent breakout.


As always, remember to trade safely with proper risk management. There are opportunities amidst the turbulence if you watch the key levels. Happy trading!
Today’s Analysis was brought to you by : Suraj Jha
Edited by : Geek Jayant