

👀 Look out : The next week is pivotal, Nifty, Sensex and Crypto Market analysis
👀 Look out : The next week is pivotal, Nifty, Sensex and Crypto Market analysis
A Roller-Coaster Awaits! Brace for a Game-Changing Week in Financial Markets accompanied by monthly closure .

BTC
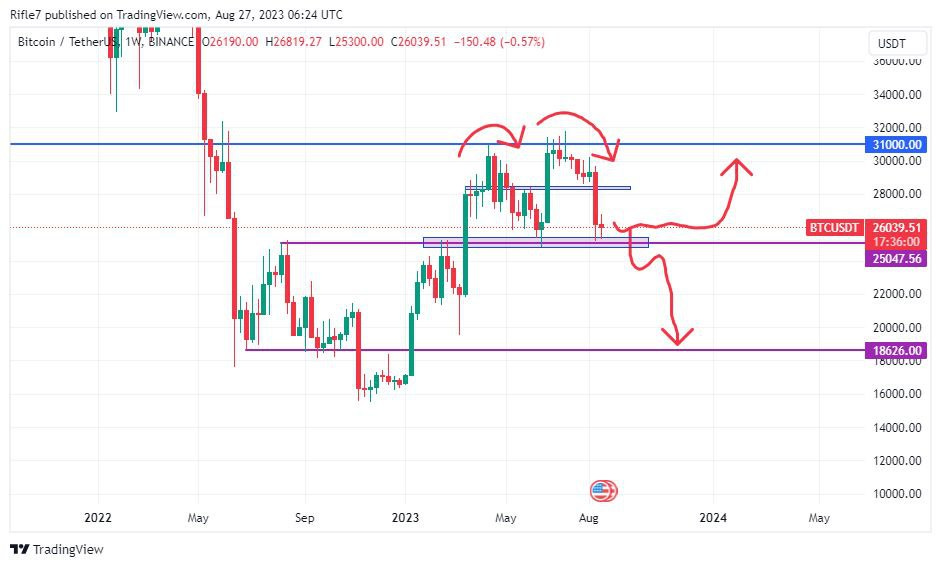
The largest cryptocurrency in the market by market cap, Bitcoin, currently valued at $26,000, has remained relatively stagnant the last week.
The weekly chart has double top forming, which will be confirmed once the support of 25k is broken, for quite a while we will just see BTC going sideways with low volatility.
Weekly support: 25047
Weekly resistance: 31000
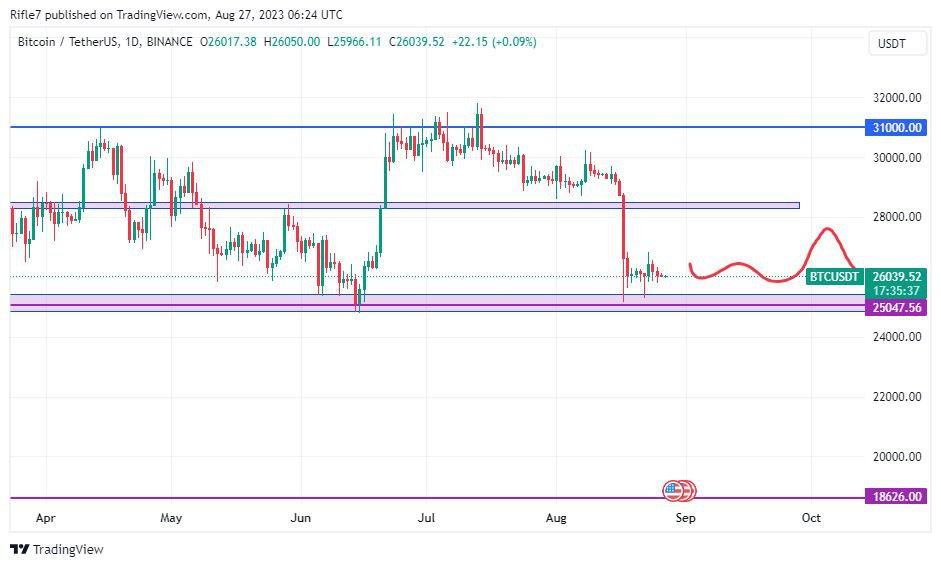
In the daily chart the nearest resistance is 28.25k-28.5k
And the support is 24.9k- 25.5

ETH
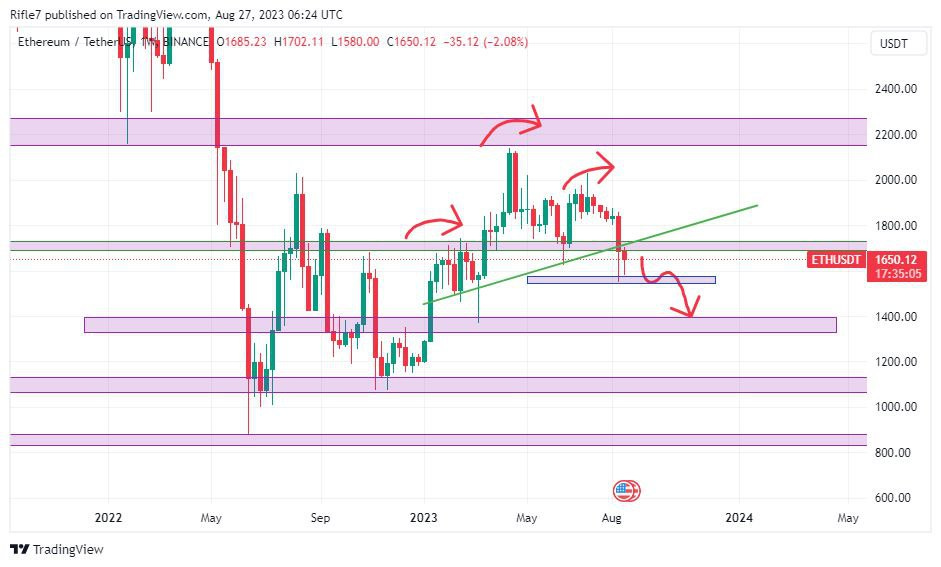
The weekly chart in ETH has broken the Head and shoulders pattern and also lost the important support of 1690-1730.
Weekly support: 1328-1400
Weekly resistance: 1690-1730
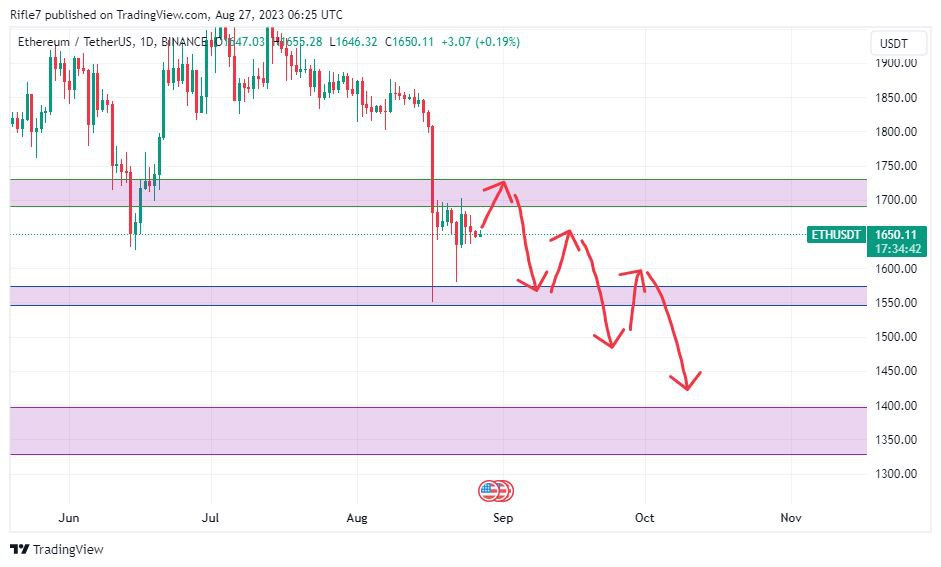
In the daily chart, once we witness closure below 1627, we are likely to see a bloodbath in ETH. So, it's better to be prepared with a short position. The resistance level is the same as weekly, but the ultimate target is 1400.
DAILY SUPPORT: 1546-1574
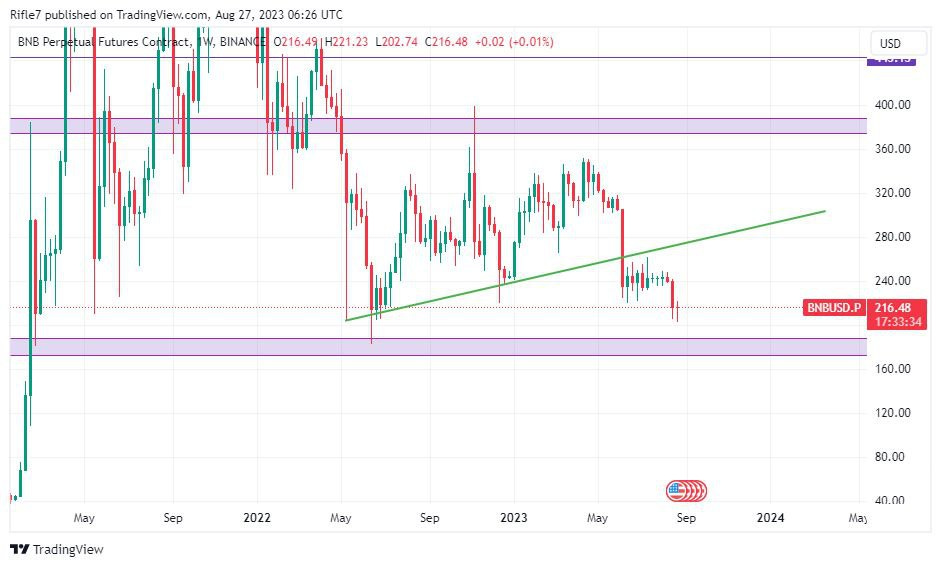
BNB
The head of the largest crypto exchange, Binance, Changpeng Zhao, was blamed for lowering the price of Bitcoin (BTC) amid regulatory pressures. According to Mike Alfred, a popular investor in the crypto community, Zhao is selling the asset to prop up the price of his Binance's BNB token.
In the weekly charts it lost a crucial support on trend line
Weekly support: 172-187
Weekly resistance: 257-178
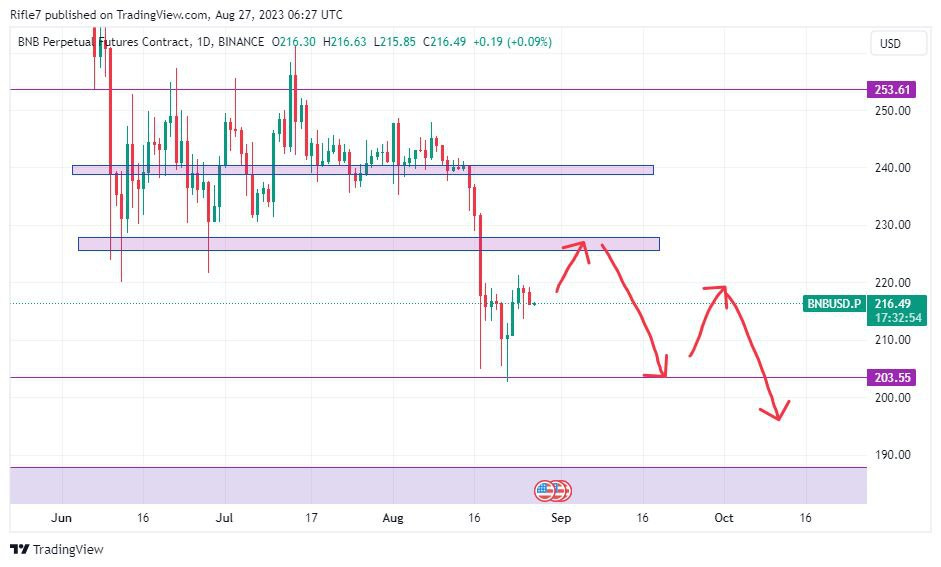
In the daily charts, it is one of the weakest charts, indicating a potential short position, From 225-227
Daily support: 203-205
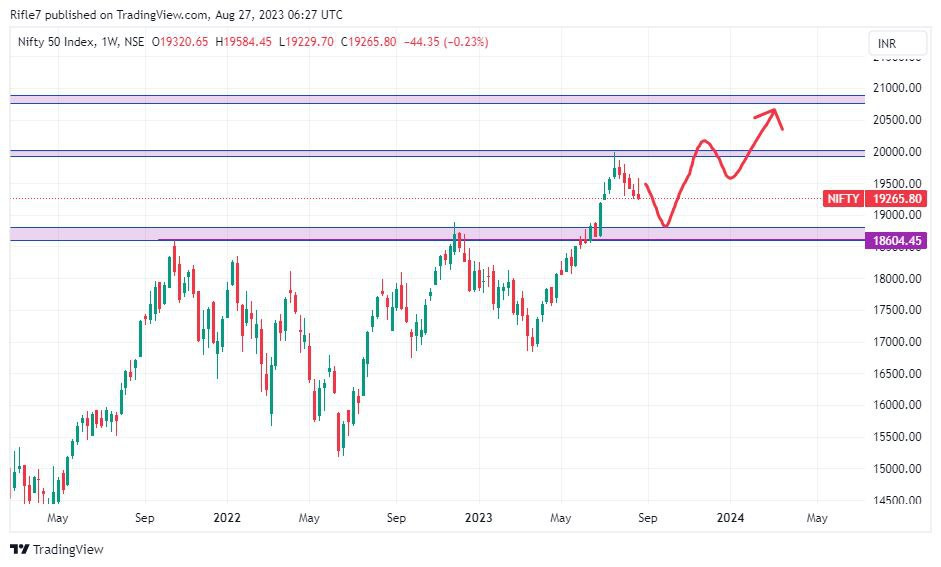
NIFTY
Indian shares opened lower on Friday amid caution after the Reserve Bank of India's (RBI) policy meeting minutes flagged inflation risks.
In the weekly charts NIFTY has reached and imp FIB Level which was not broken
Nearest support: 18600-18804
Resistance: 19929-20015
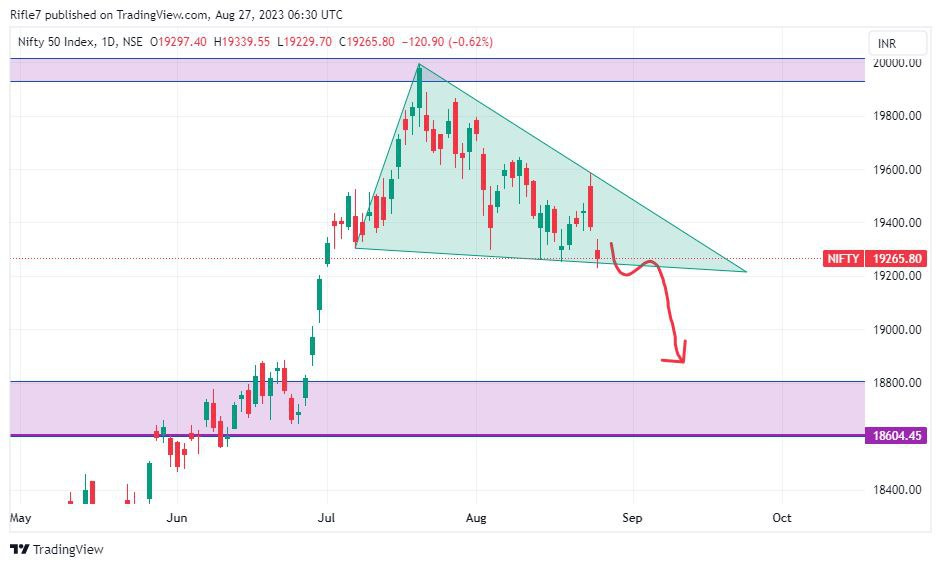
In the daily chart on close below 19300,we are most likely to see continuing downside till 18800.The trendline has also been acting as resistance.
Daily support:1800
Daily resistance:19370-19400
SENSEX
After making a higher high its time for retracement towards support levels. According To FIB it should be around 63010-63354 and the resistance is 66958-67329.
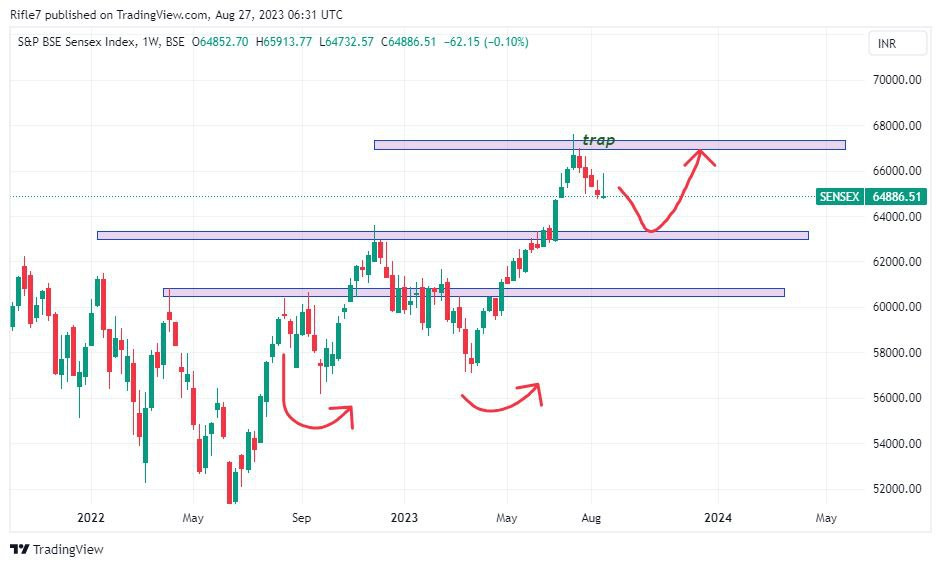
In the daily chart the trend line is acting as a resistance ,the levels are 65566-65749.

Happy Sunday & Happy Trading, See you in the next analysis!
