

Is Recession coming?
Is Recession coming?
How it will effect the markets!
In today’s newsletter, we will discuss how recessions occur and how they have historically impacted the market.
What is a recession?
There are many ways to define a recession but it mostly comes down to this:
”A recession is slowing down of an economy over a business cycle”. There are various other definitions for it that varies country to country so what happens in a recession is more important than what is a recession for us.
What happens in a recession?
A recession can have different effects on the economy depending on what caused the recession it is generally a combination of one or more of these factors-
Rising Unemployment.
Rise in bankruptcies.
Falling interest rates.
Lower consumer spending.
Falling asset prices like real estate & stocks.
Now, these factors shrink the GDP over quarters and cause what we call a “Recession”.
Here is a chart for all these factors in the current situation-
1. Unemployment Rates
Current-

Forecasted-

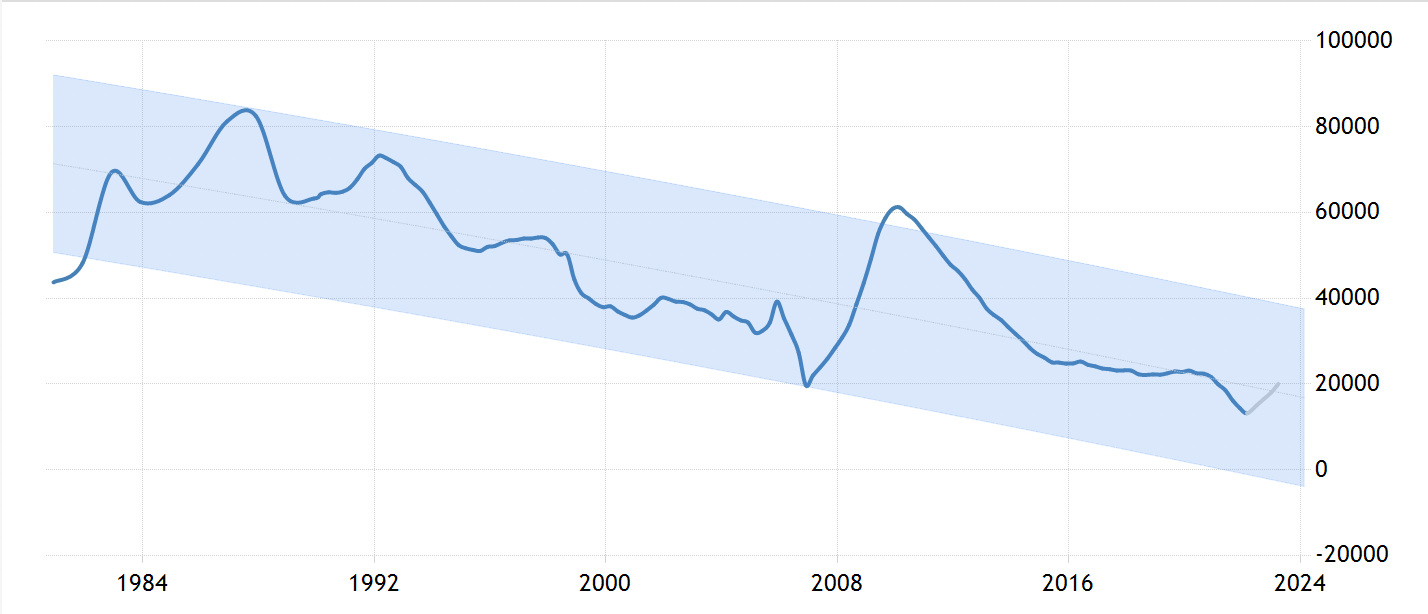
2. Reported Bankruptcies
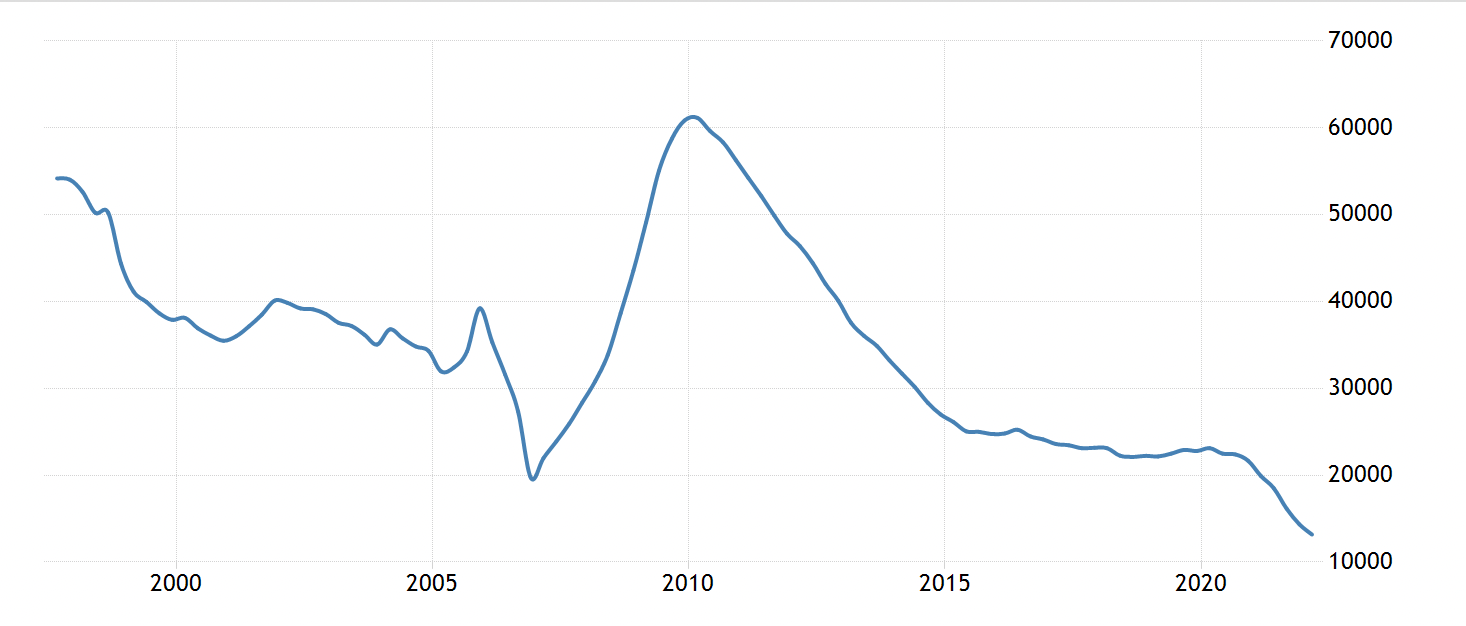
Forecasted-

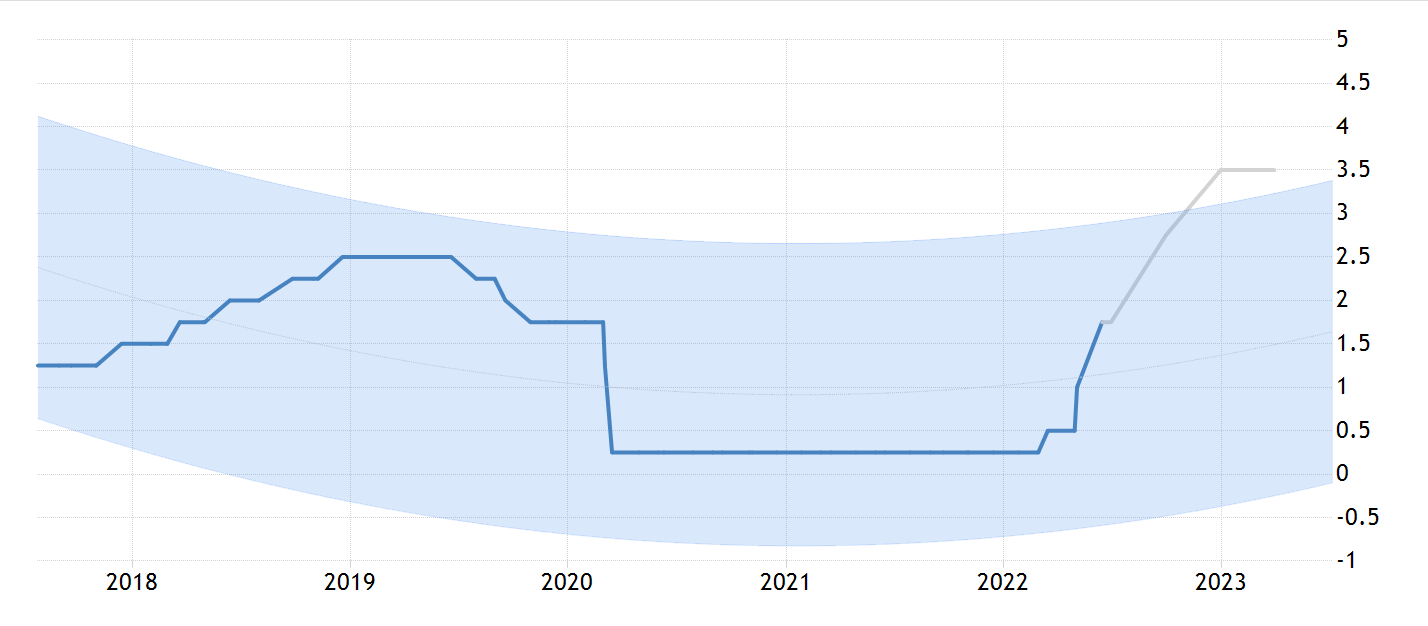
3. Funding Rates
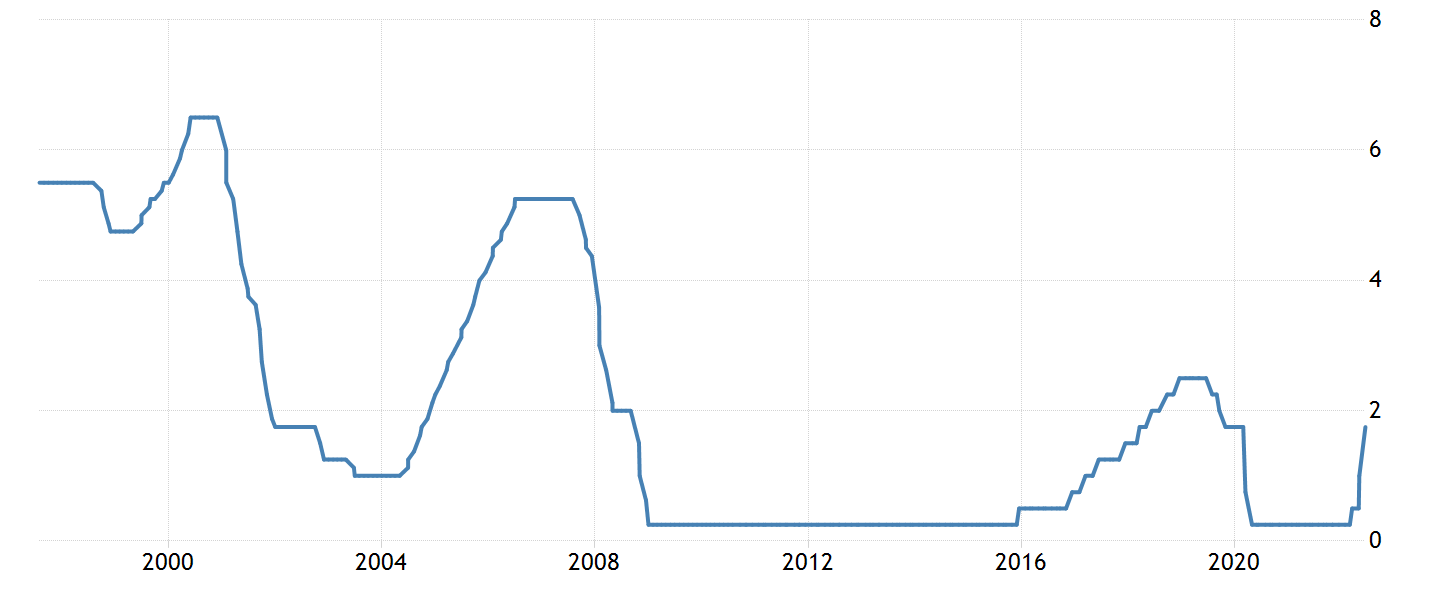
Forecasted-
4. Consumer Spending


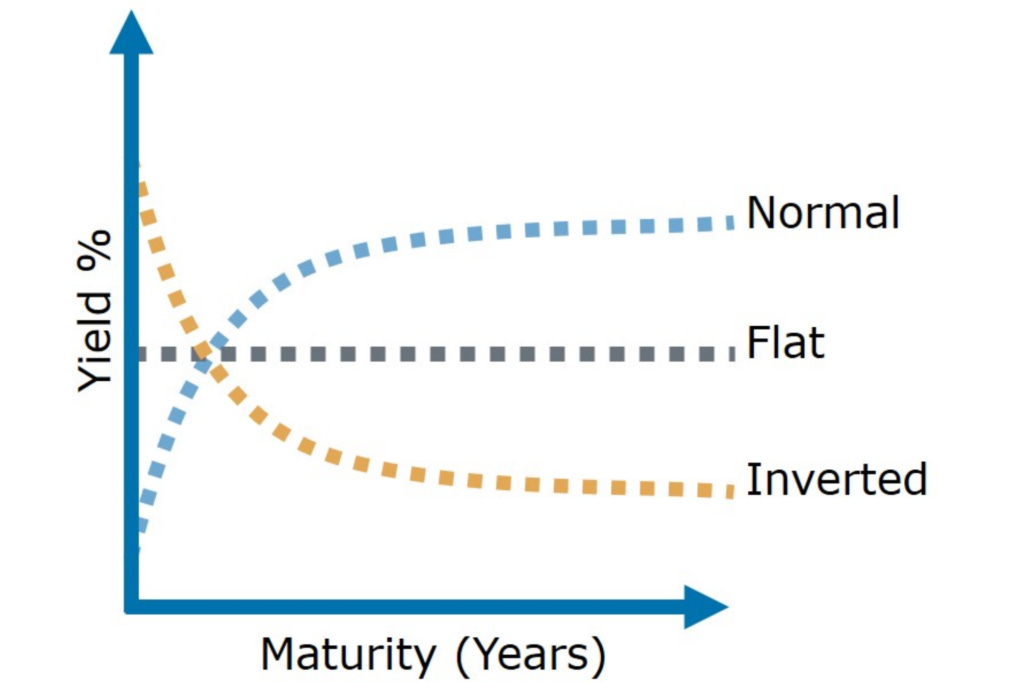
The Yield Curve indicator

The yield curve is a complex topic but is one of the best indicators of a recession. I will try to break it down as simply as possible.
A yield curve is plotted on the XY axis such that the Y-axis denotes the % yield of the security and the X-axis denotes the time period of borrowing that security.

Now how does it predict a recession?
The yield curve tracks the yields of US treasury bonds.
Now ideally longer time period bonds have more yield than short-term bonds. When this is the case we are having a Normal yield curve. This is the best scenario.
Sometimes we see the yield of long-term bonds and short-term bonds start approaching each other this causes the curve to become flat. This will indicate a recession might be coming.
When the yield of short-term > long-term bonds then we see an inverse yield curve and this indicates a recession.
How accurate is it?
It has predicted 7/10 recessions.