
In today’s video, I talked about a method to identify whether any coin has stopped falling or will it fall more so you can time your entries as accurately as possible.
So what is the double bottom pattern?
People who have studied my course on technical analysis are only familiar with how to spot and trade a double bottom for people who want to learn read on….
The double bottom occurs at the end of a downtrend and looks like a “W” symbol.
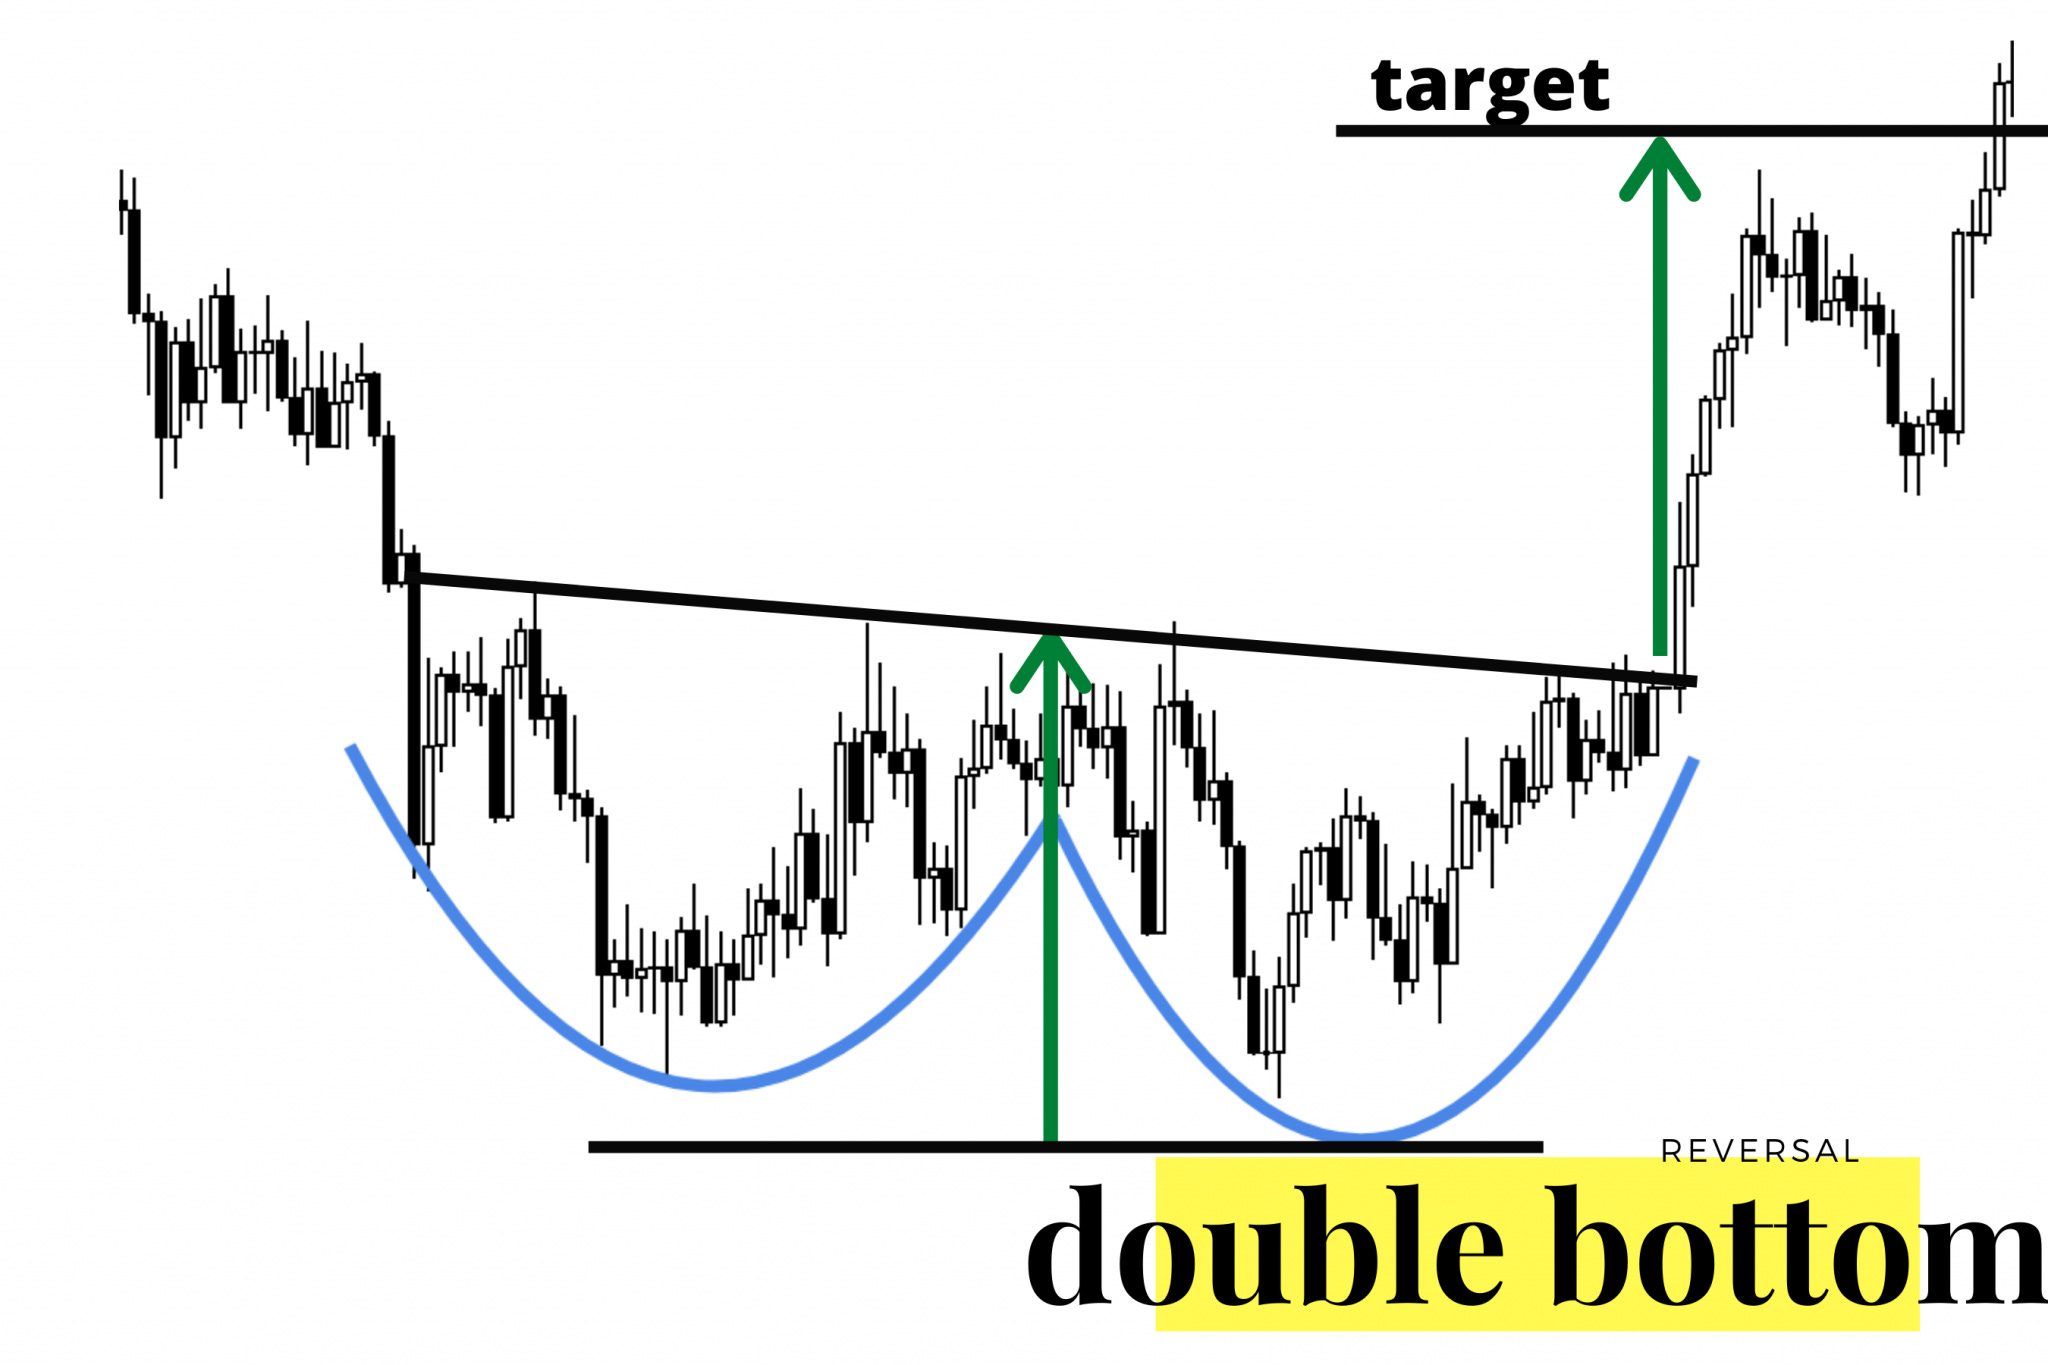
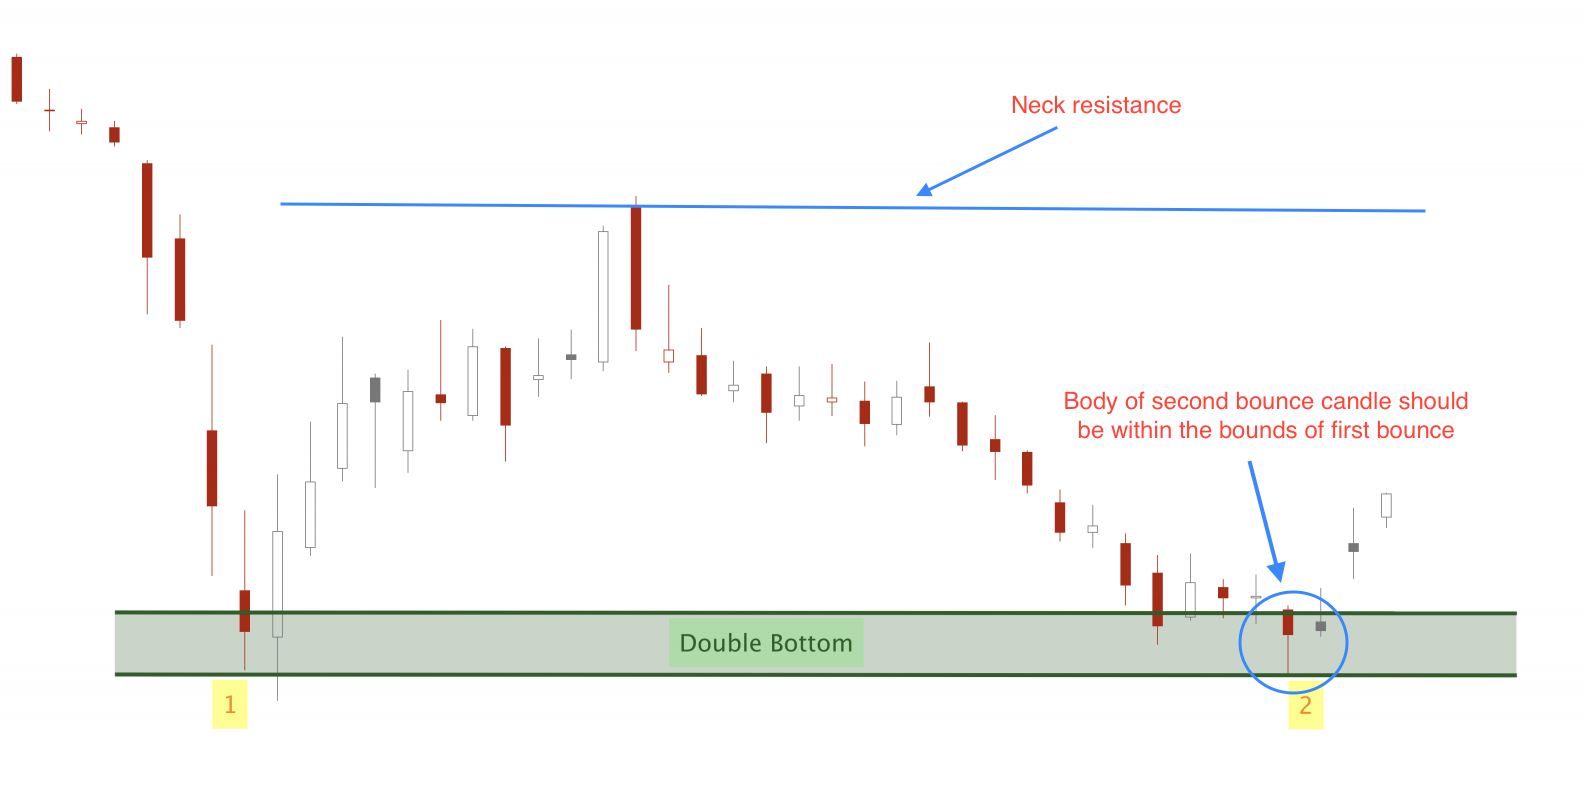
As you can see it has 2 bounces, the first bounce from the support goes up 10-15% before coming down again for the support. The peak after the first bounce becomes the Neck-Resistance.
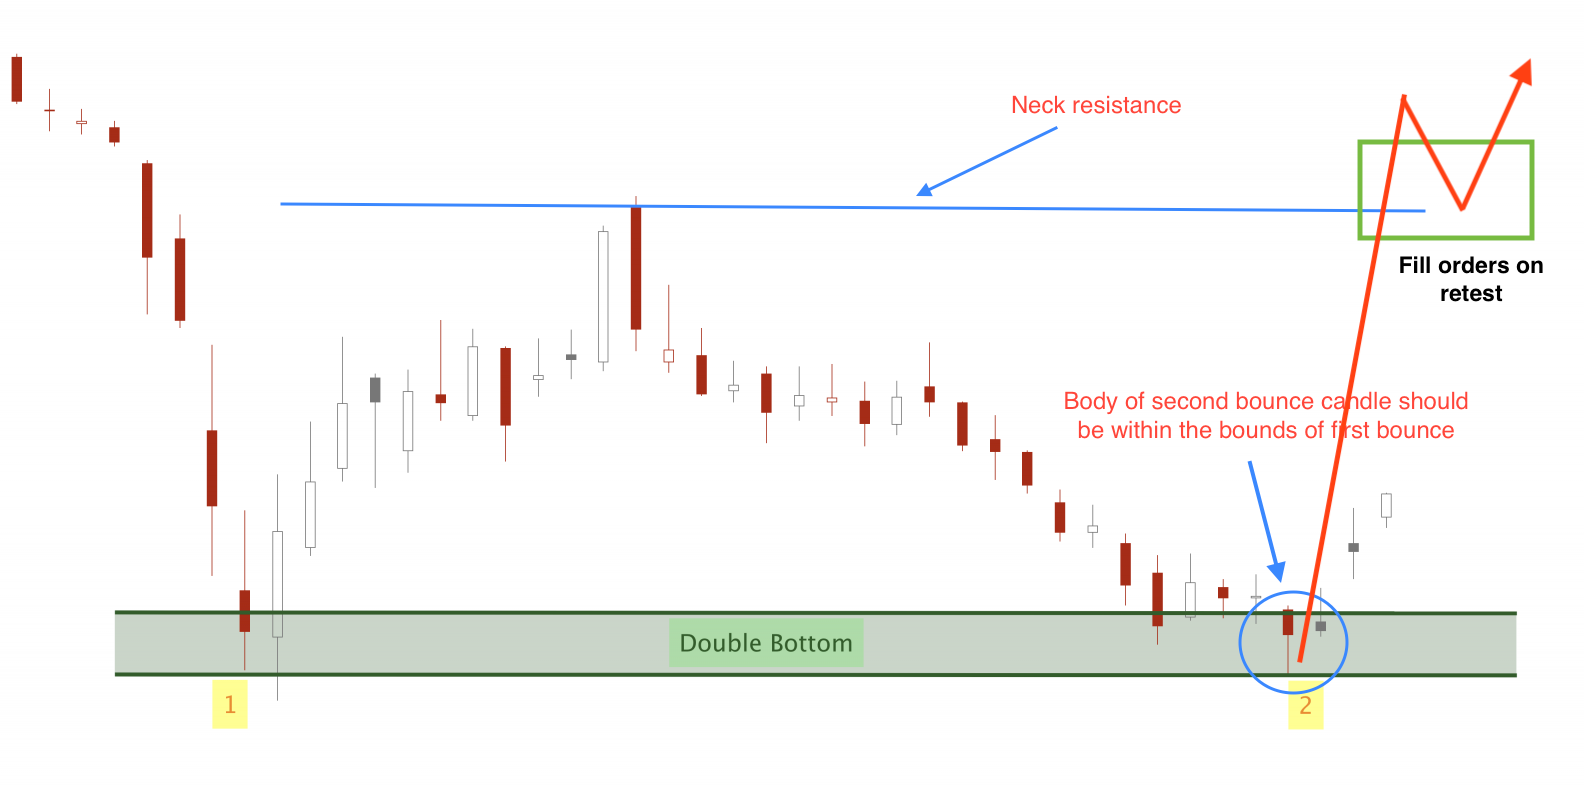
Breaking this neck resistance ideally with a retest is extremely important for a pattern to play out.
On larger time frames like daily and weekly, double bottom works best with more distance between the two bottoms the better.
Here is how to trade this pattern-
If you liked this article subscribe to the newsletter for more. Want to learn more about technical analysis?
Get my course on technical analyasis tailor-made for beginners!