

Bitcoin and Altcoin Analysis : Are we at the end of Crypto Winter?
Bitcoin and Altcoin Analysis : Are we at the end of Crypto Winter?
GM Traders! This is TeamJargon.
Today we bring you this weeks analysis of :
Bitcoin
Ethereum
XRP
Rune
ChainLink
Today’s price of these assets 👇
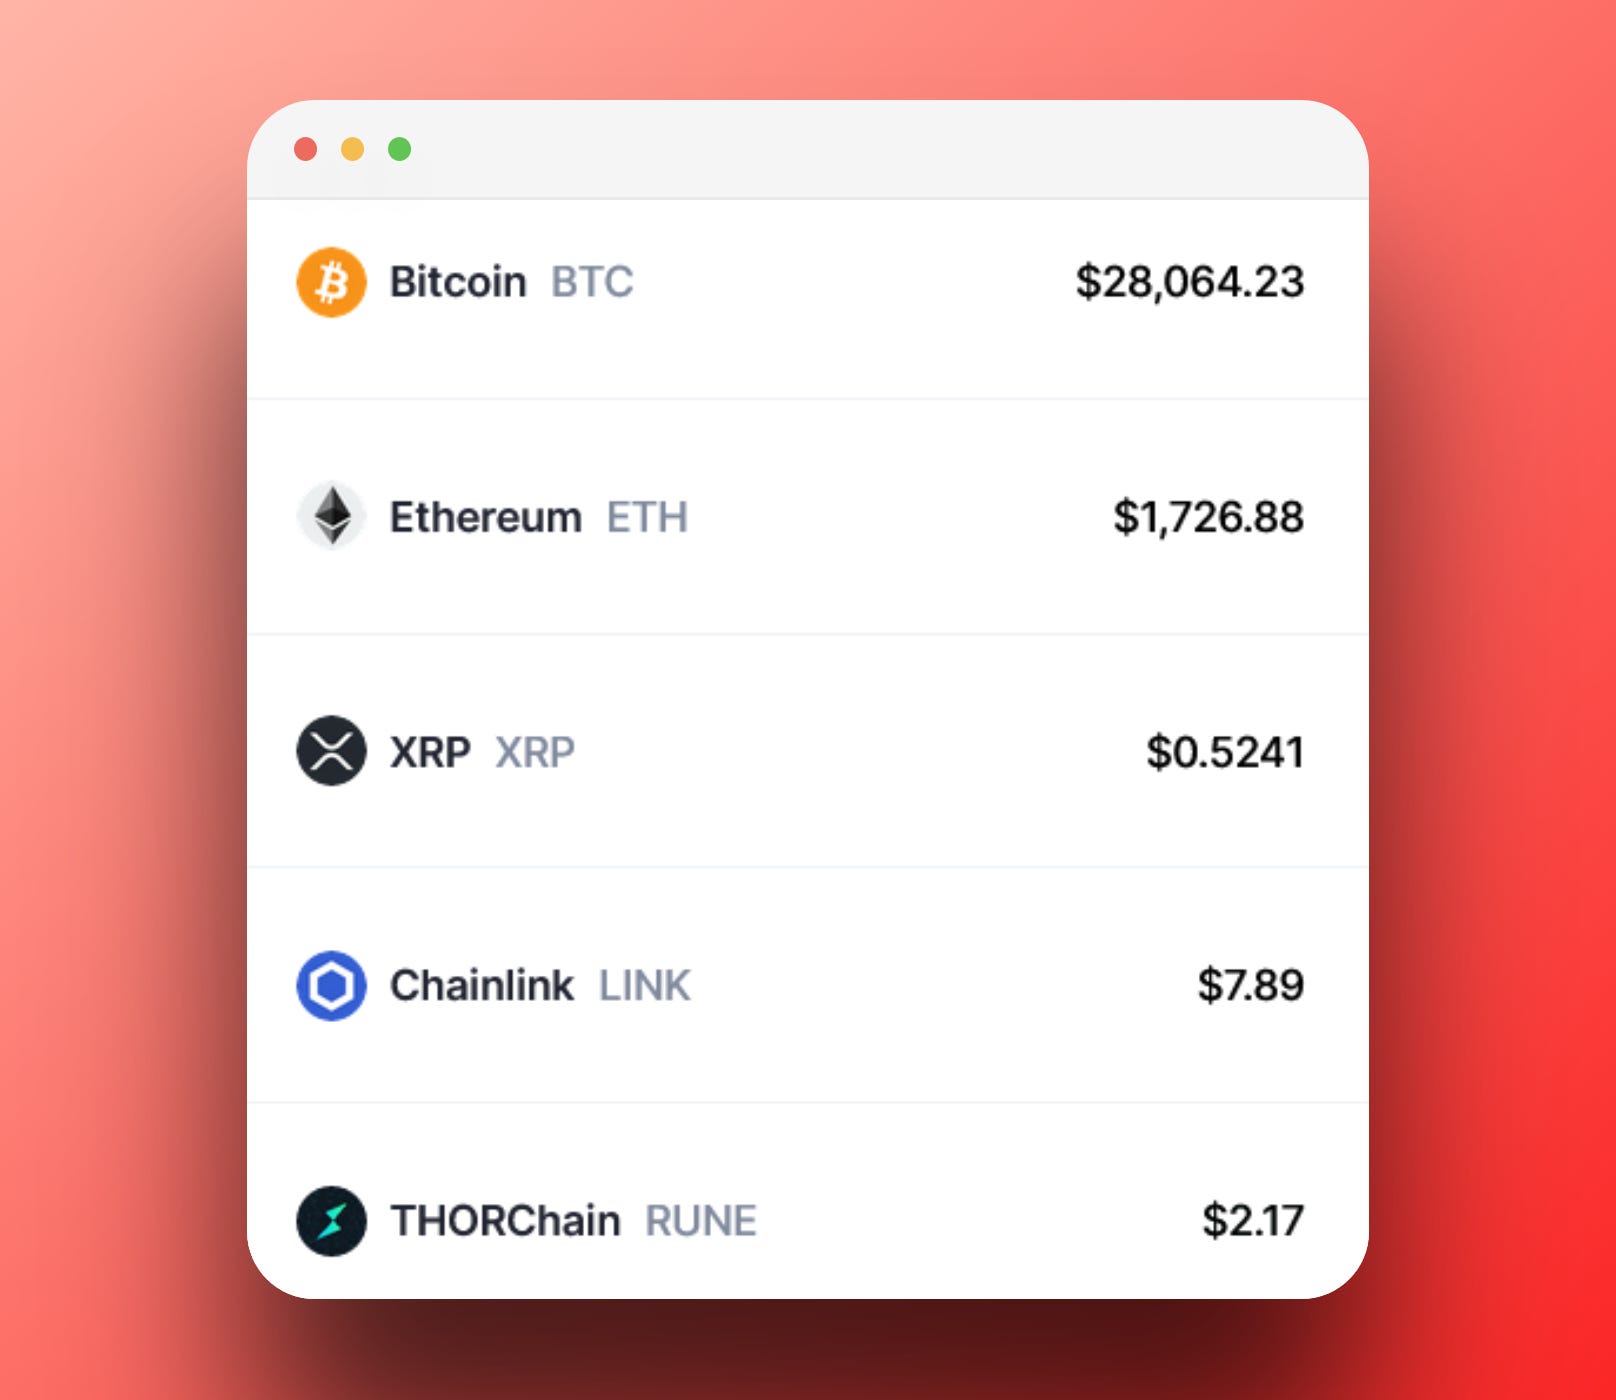
Market Sentiment : Neutral 🟨


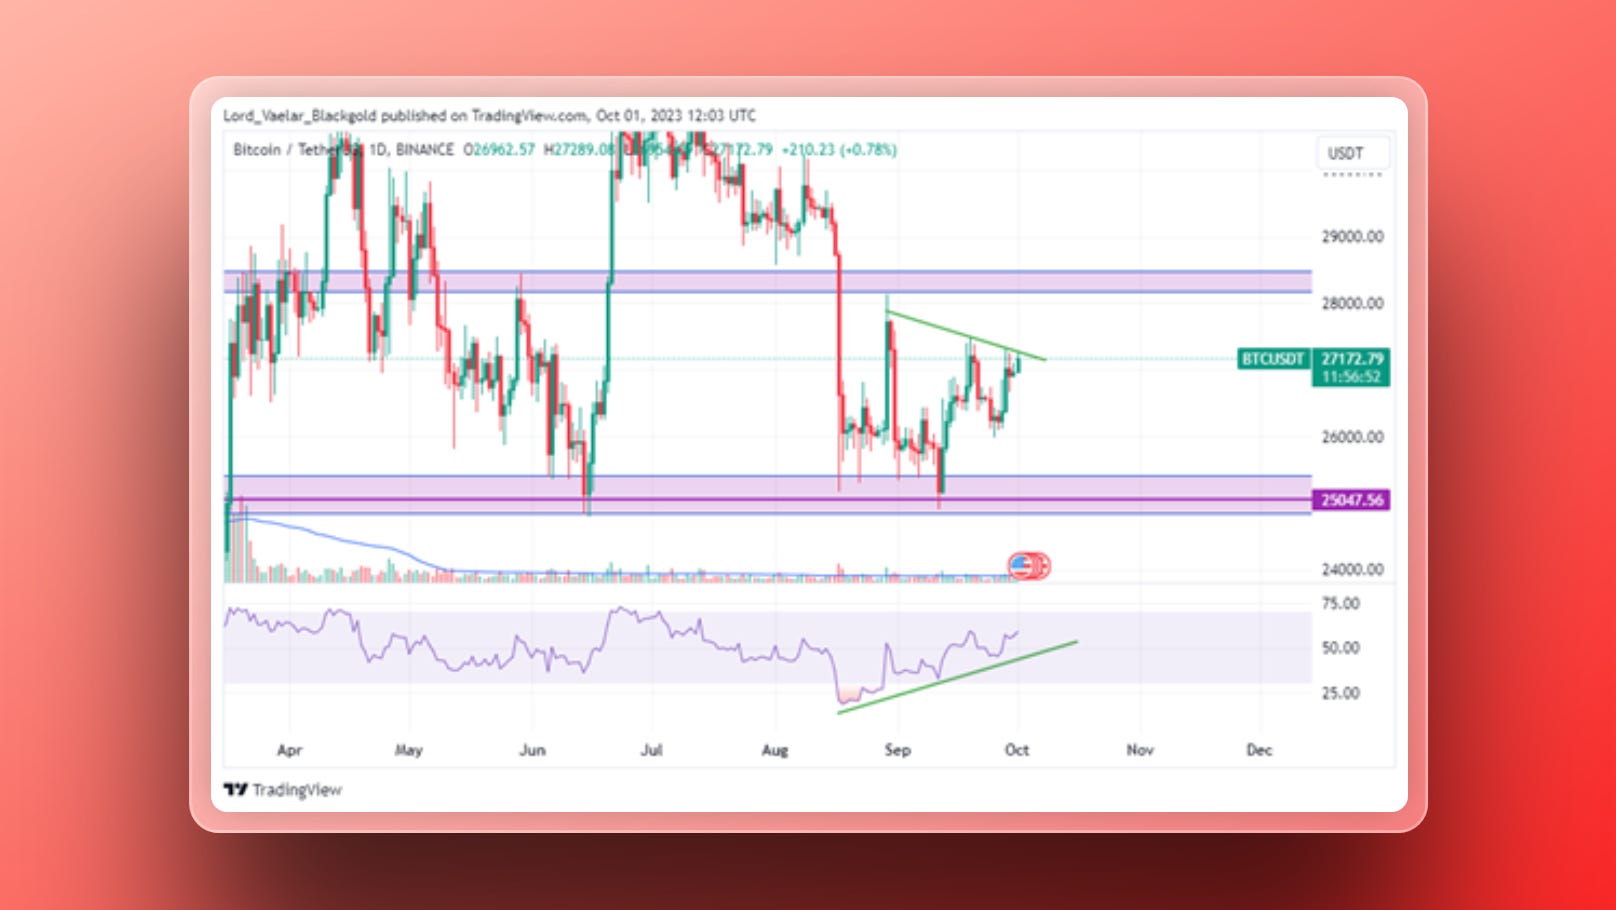
1. Bitcoin
BTC is still range-bound in 25k-28.1k
The production cost of $BTC is 37k, the miners are in loss, price is 35% away from breakeven.
There is hidden bullish divergence forming in $BTC in daily timeframe
On the break of trendline a good upside movement is expected
Daily support: 25047
Daily resistance: 28.1k-28.4k
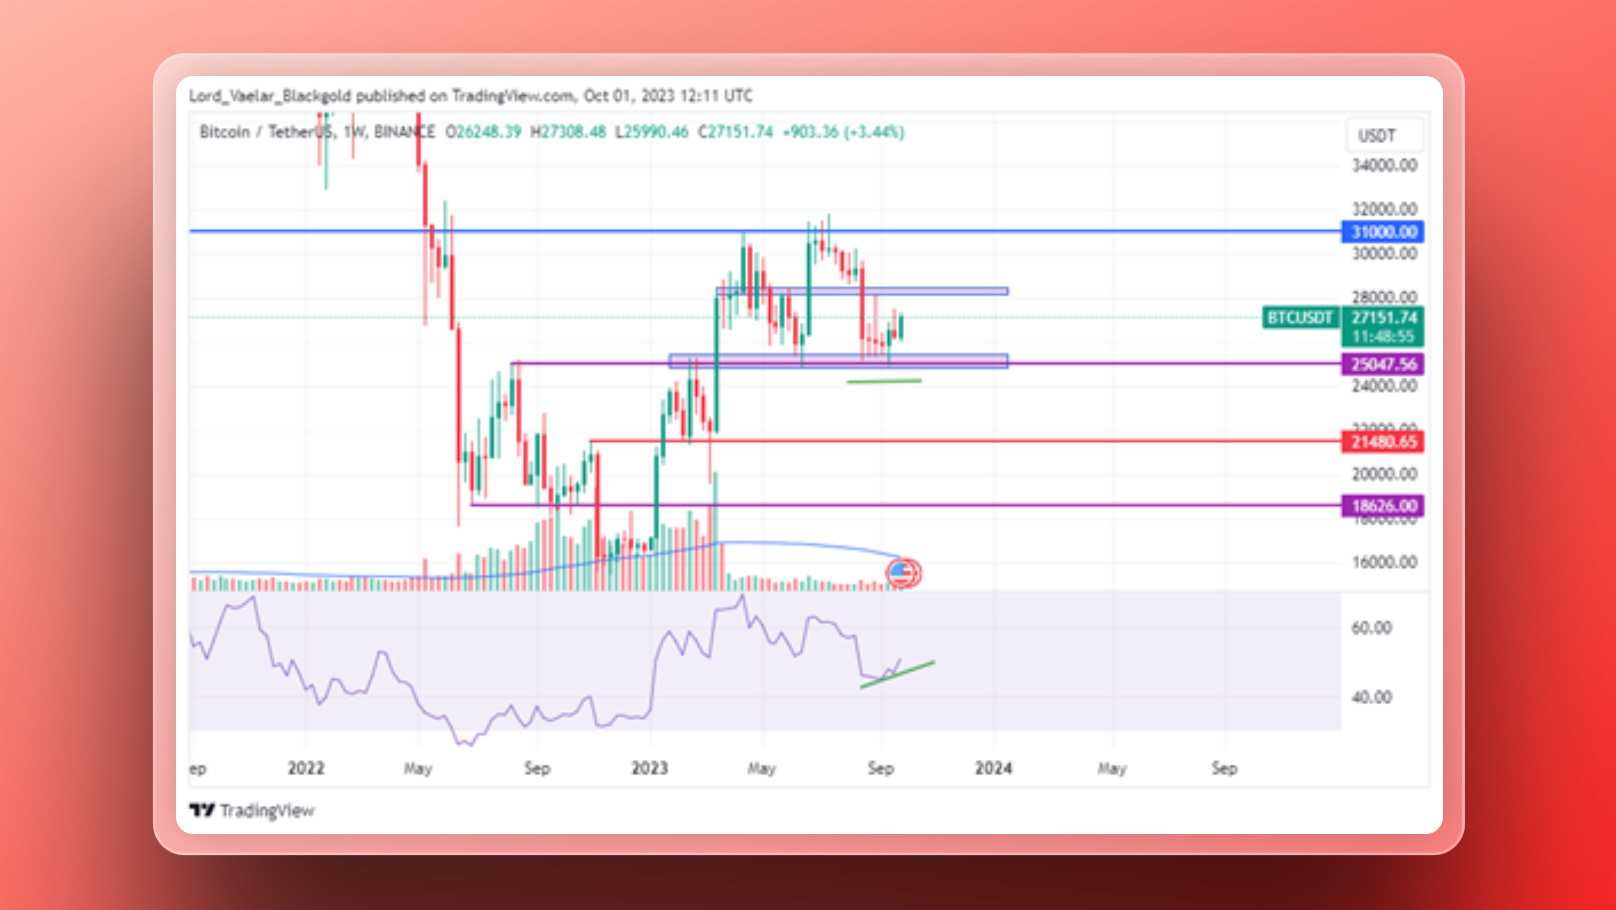
In the weekly chart, RSI is showing divergence while price was sideways that is good for bullish momentum.

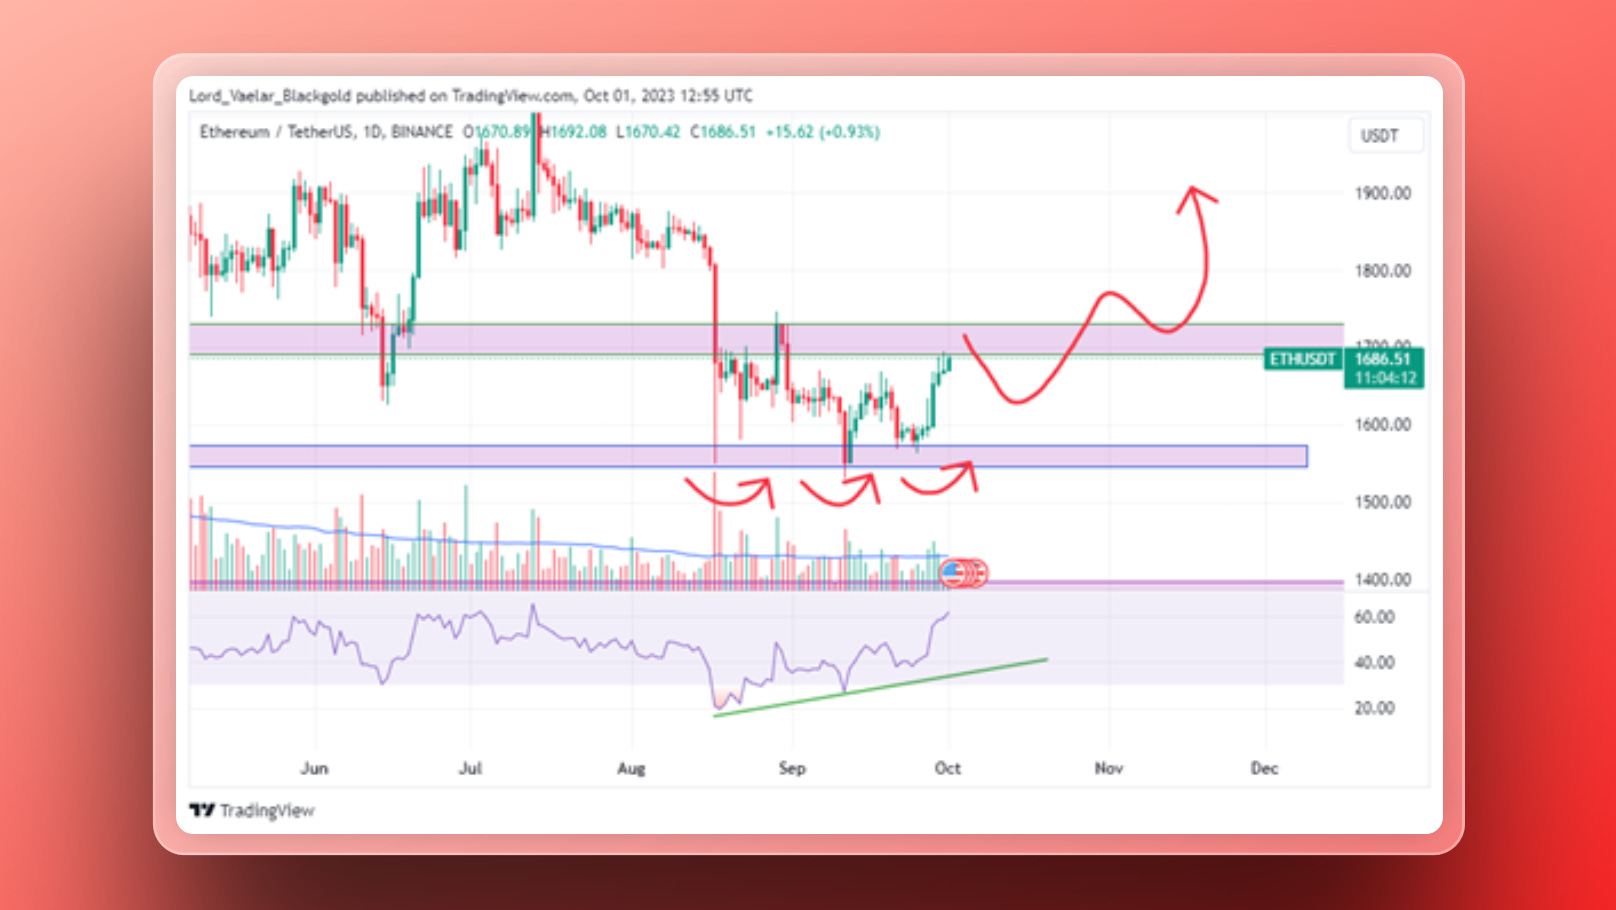
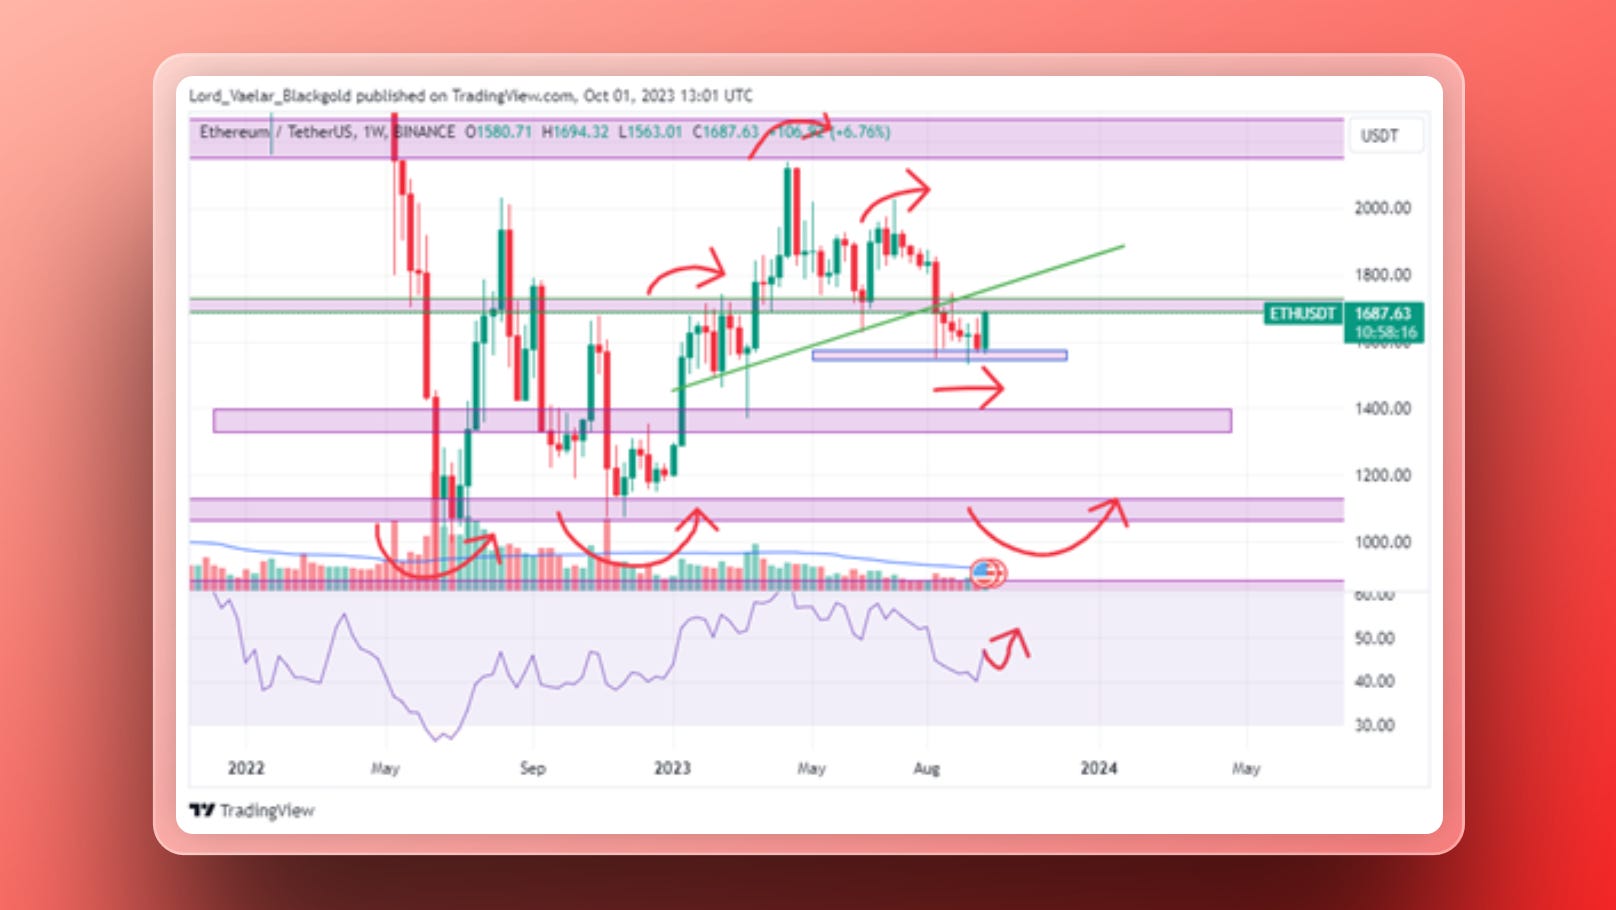
2. Ethereum
After sinking roughly 30% from 2023 highs, Ethereum appears to be bouncing off from the pits of the crypto winter. Looking at candlestick arrangements in the daily and weekly charts, the coin has primary support at around $1,500 and is firm, bouncing off with decent trading volume.
The daily charts are as follows:
The idea is, if the price closes above the resistance then we will long. Till then short.
Support: 1573-1544
Resistance: 1691-1730
In The weekly chart while the price has been ranging, the RSI forms a higher high. We will start looking for longs as Oct may have the hype of ETH futures ETF.

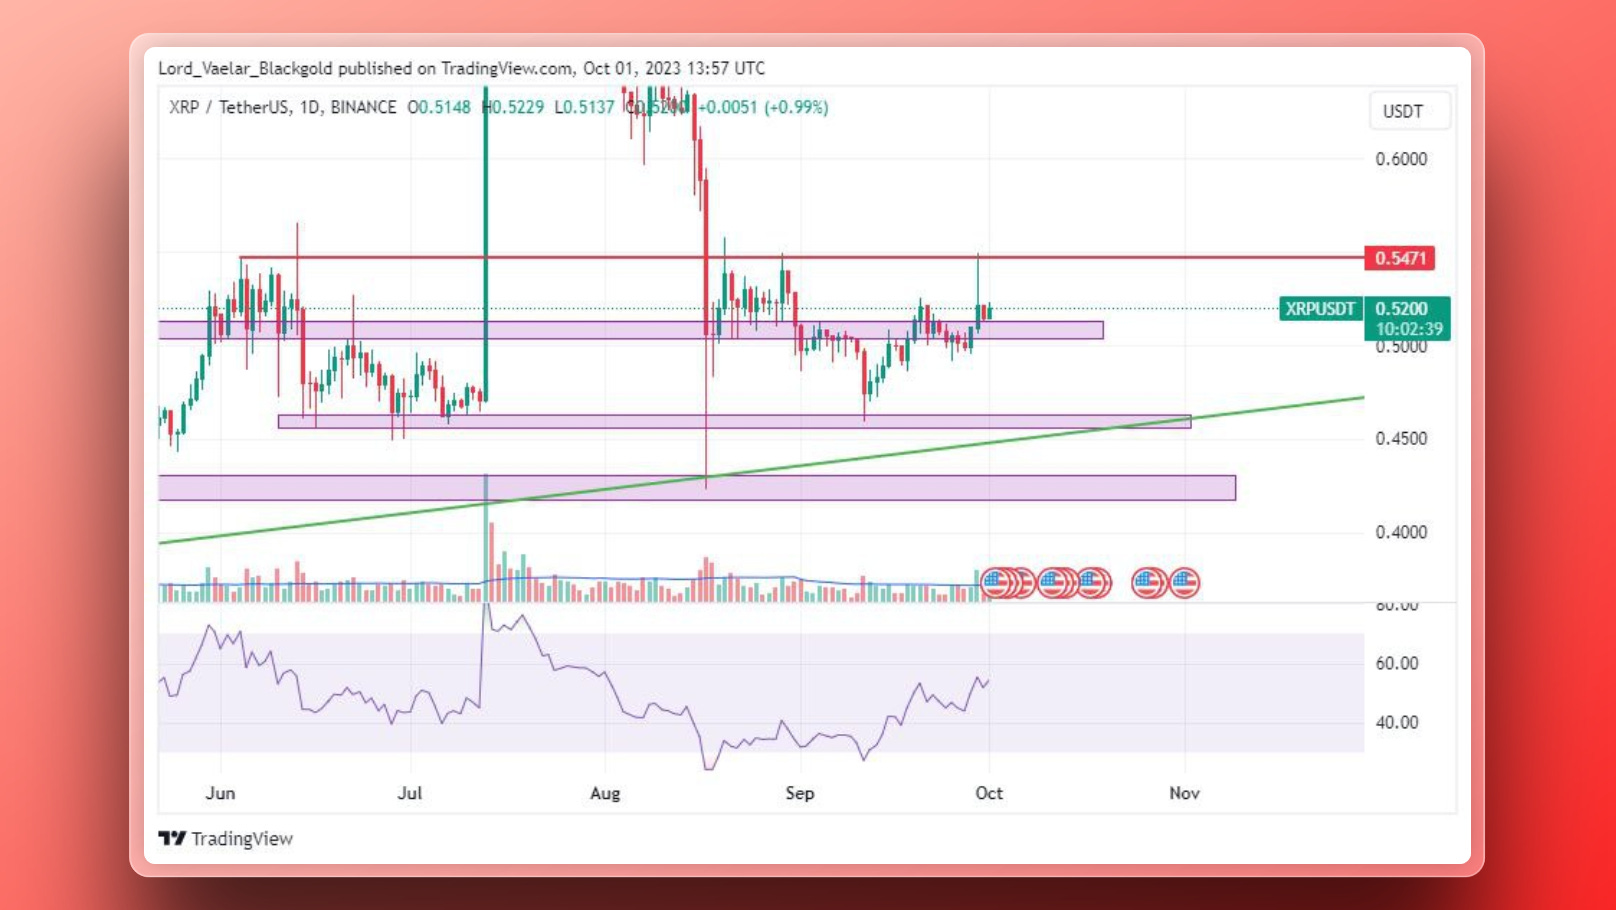
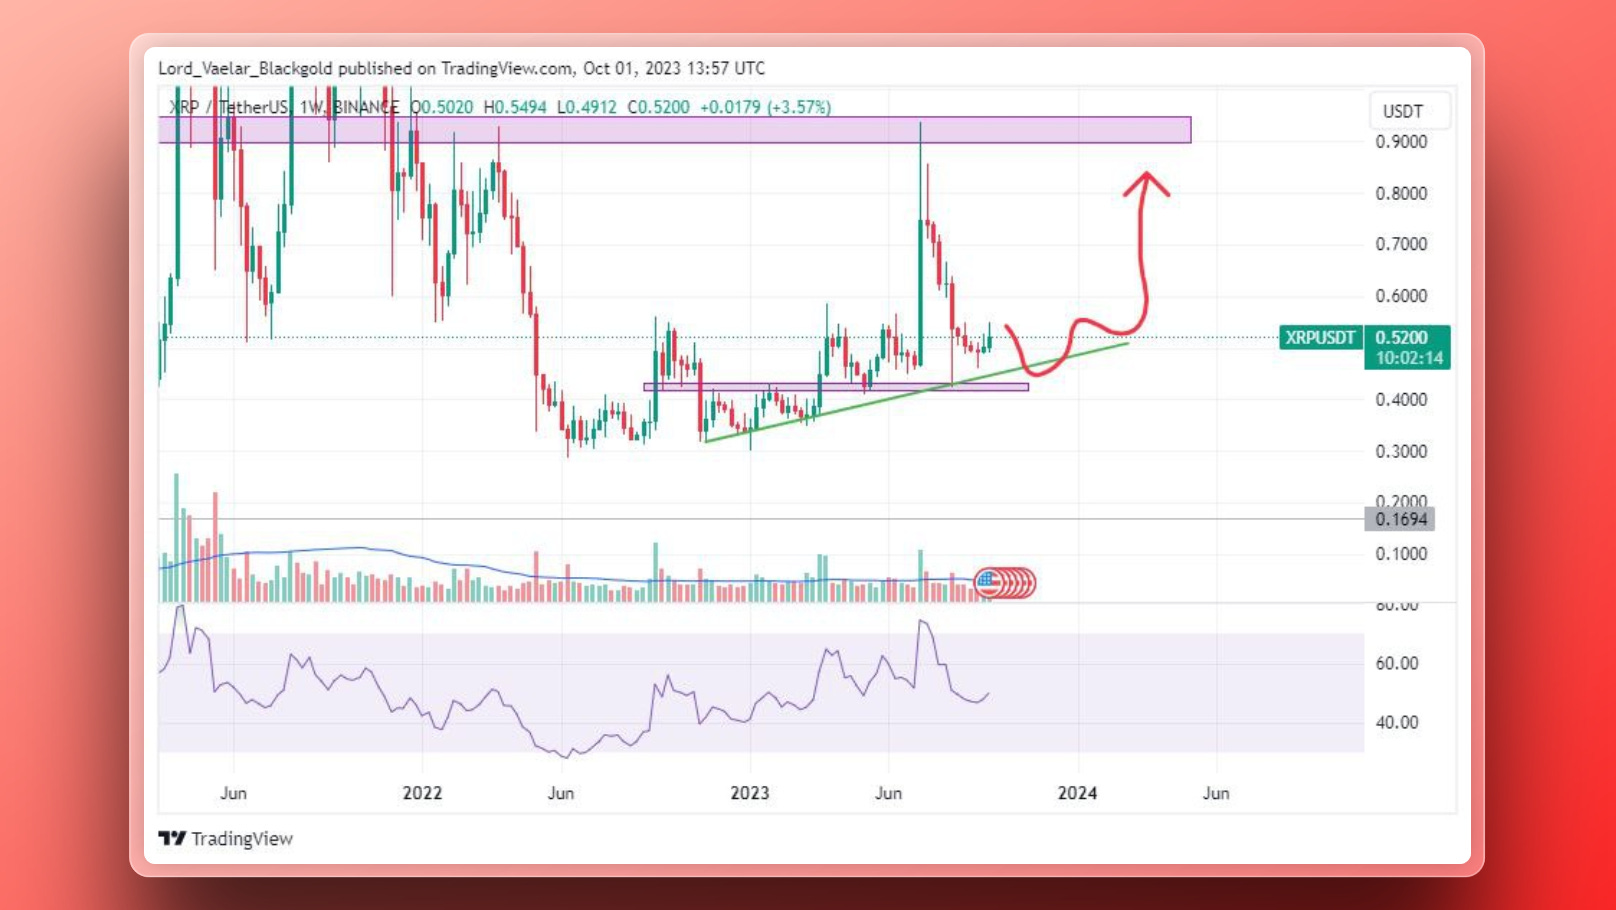
3. XRP
A broader perspective on XRP's price performance can be attributed to an analysis of historical accumulation trends. This concept revolves around the belief that the longer an asset remains in an accumulation phase, the more impactful the subsequent breakout becomes. Recently, multiple accumulation zones were identified for XRP, each phase contributing to significant price multipliers.
Daily support: 0.5037-0.5129
Daily support 2: 0.4629-0.4565
Resistance: 0.5471

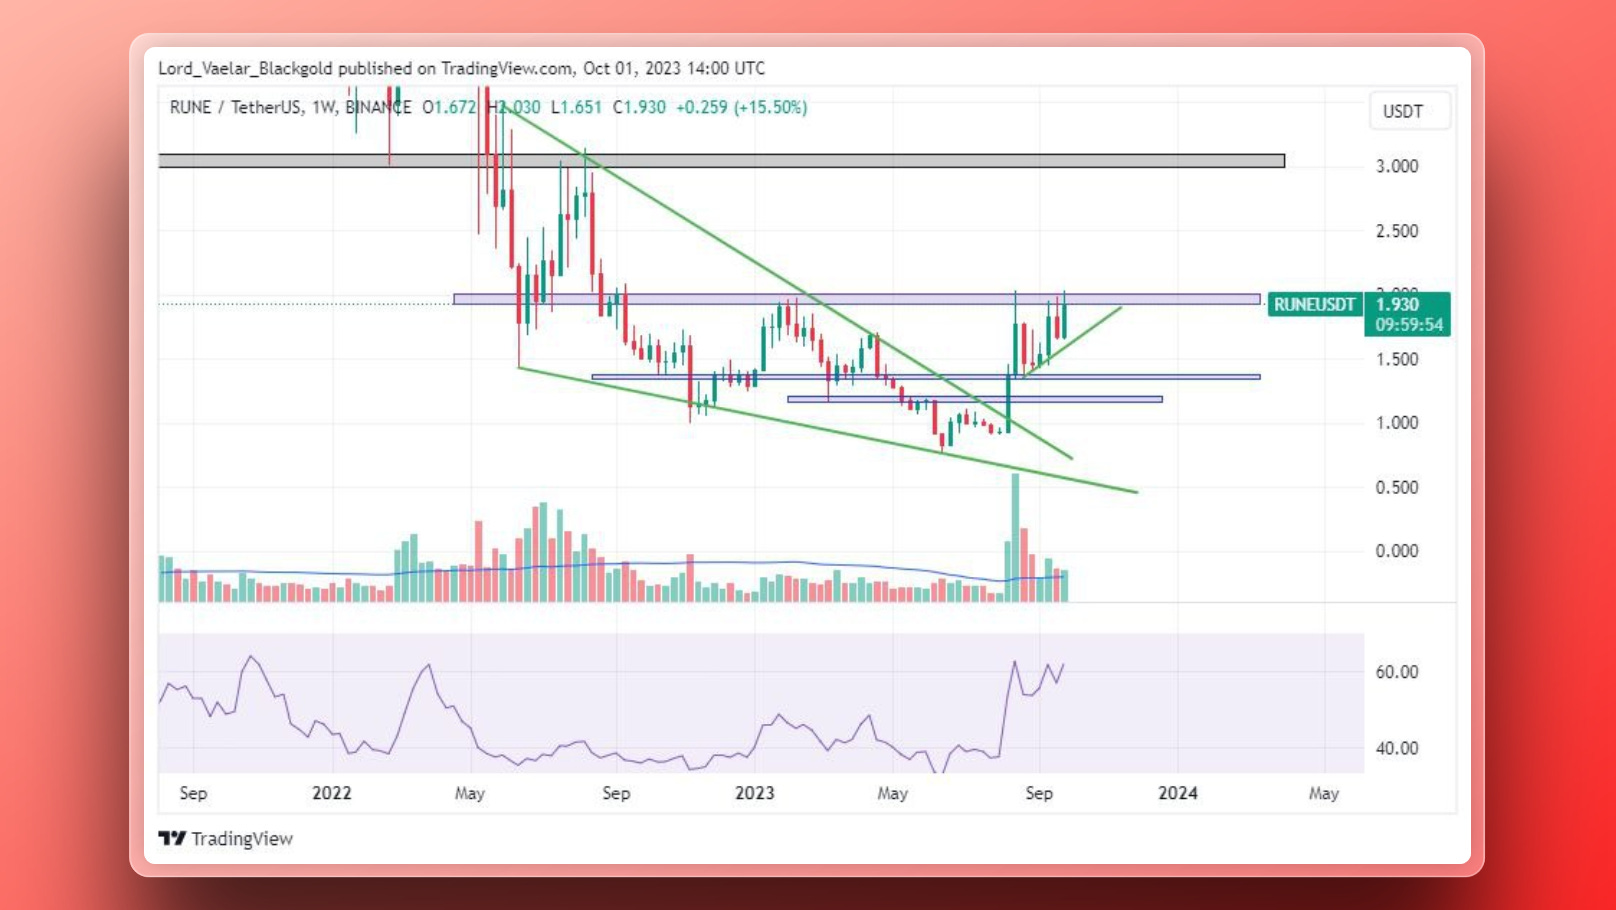
4. RUNE
After a good rally rune has reached its resistance at 1.932-2.01
Support : 1.645 - 1.7
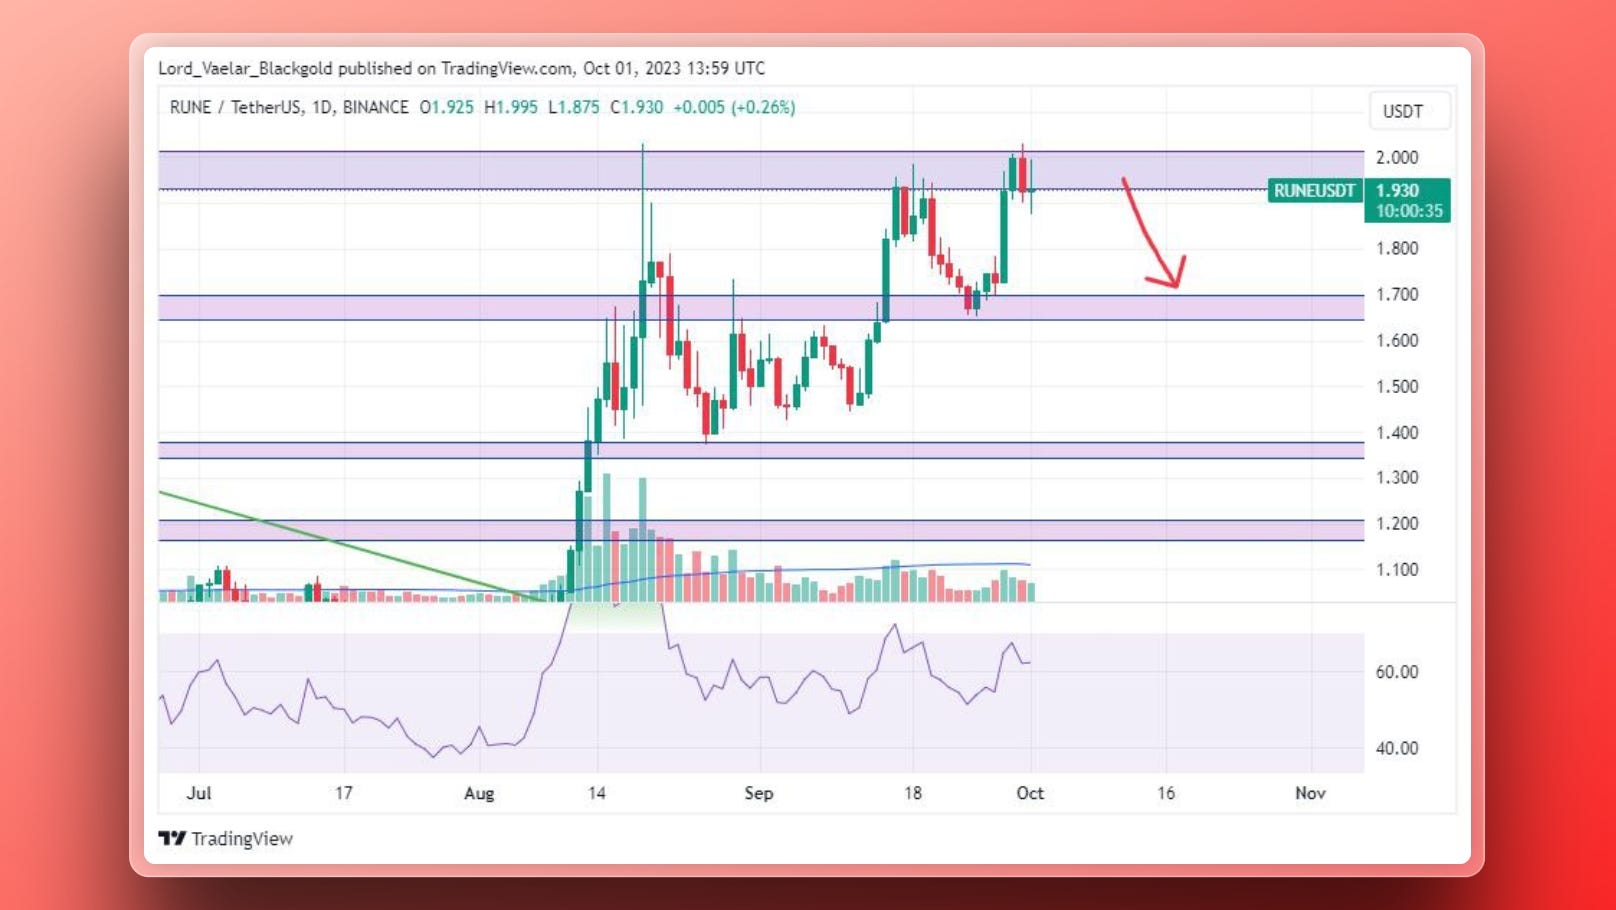
The weekly chart has a bull flag forming which will push the price further

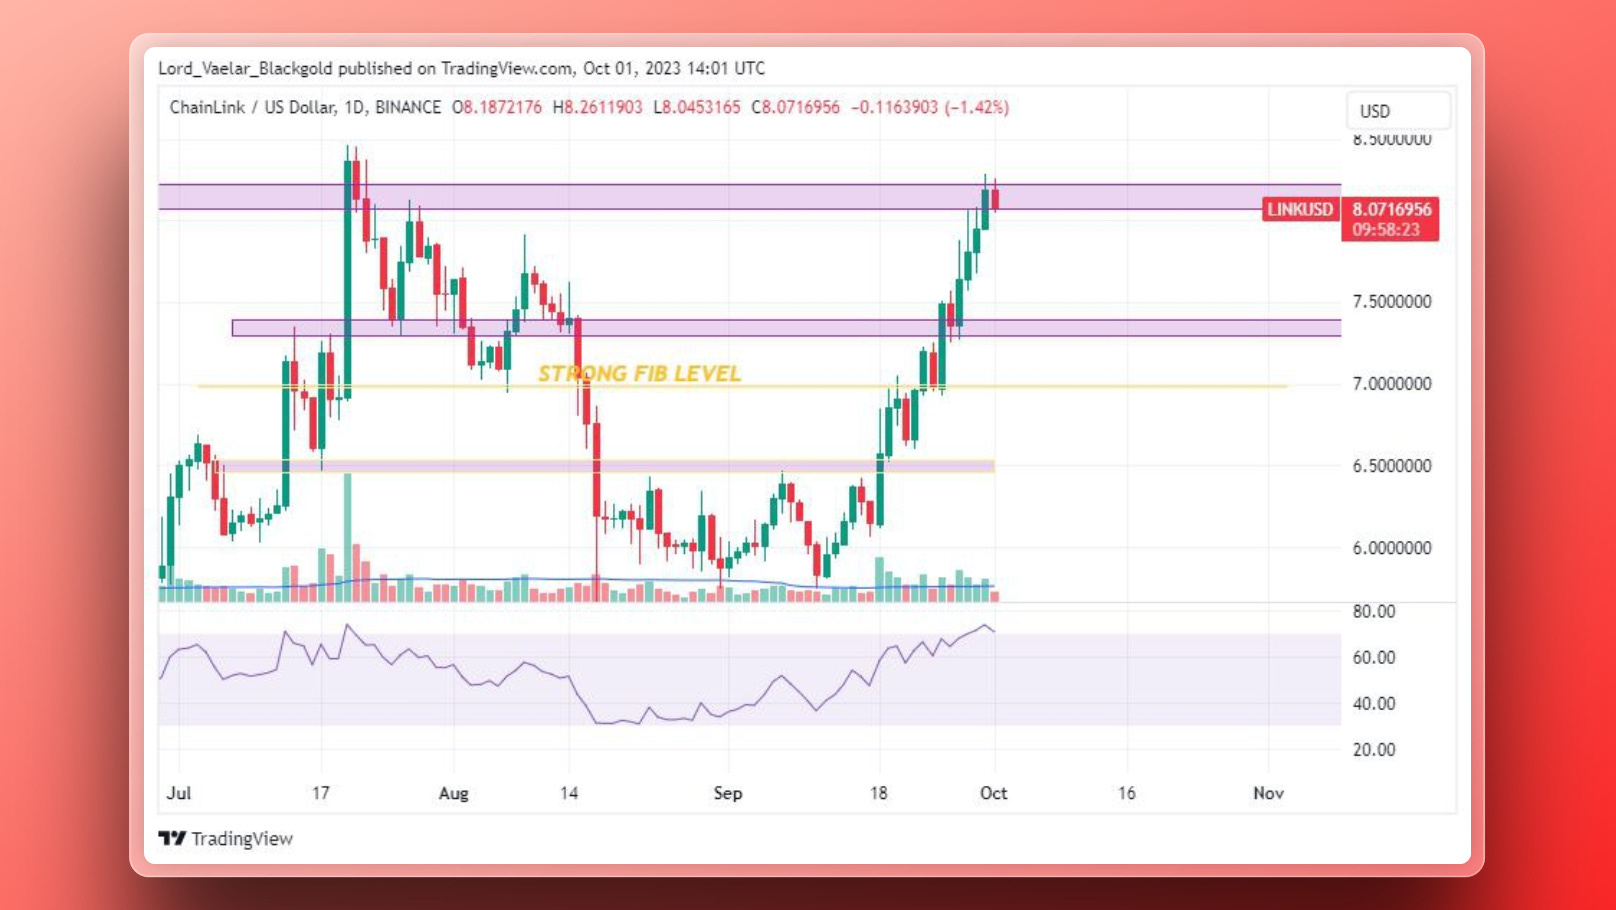
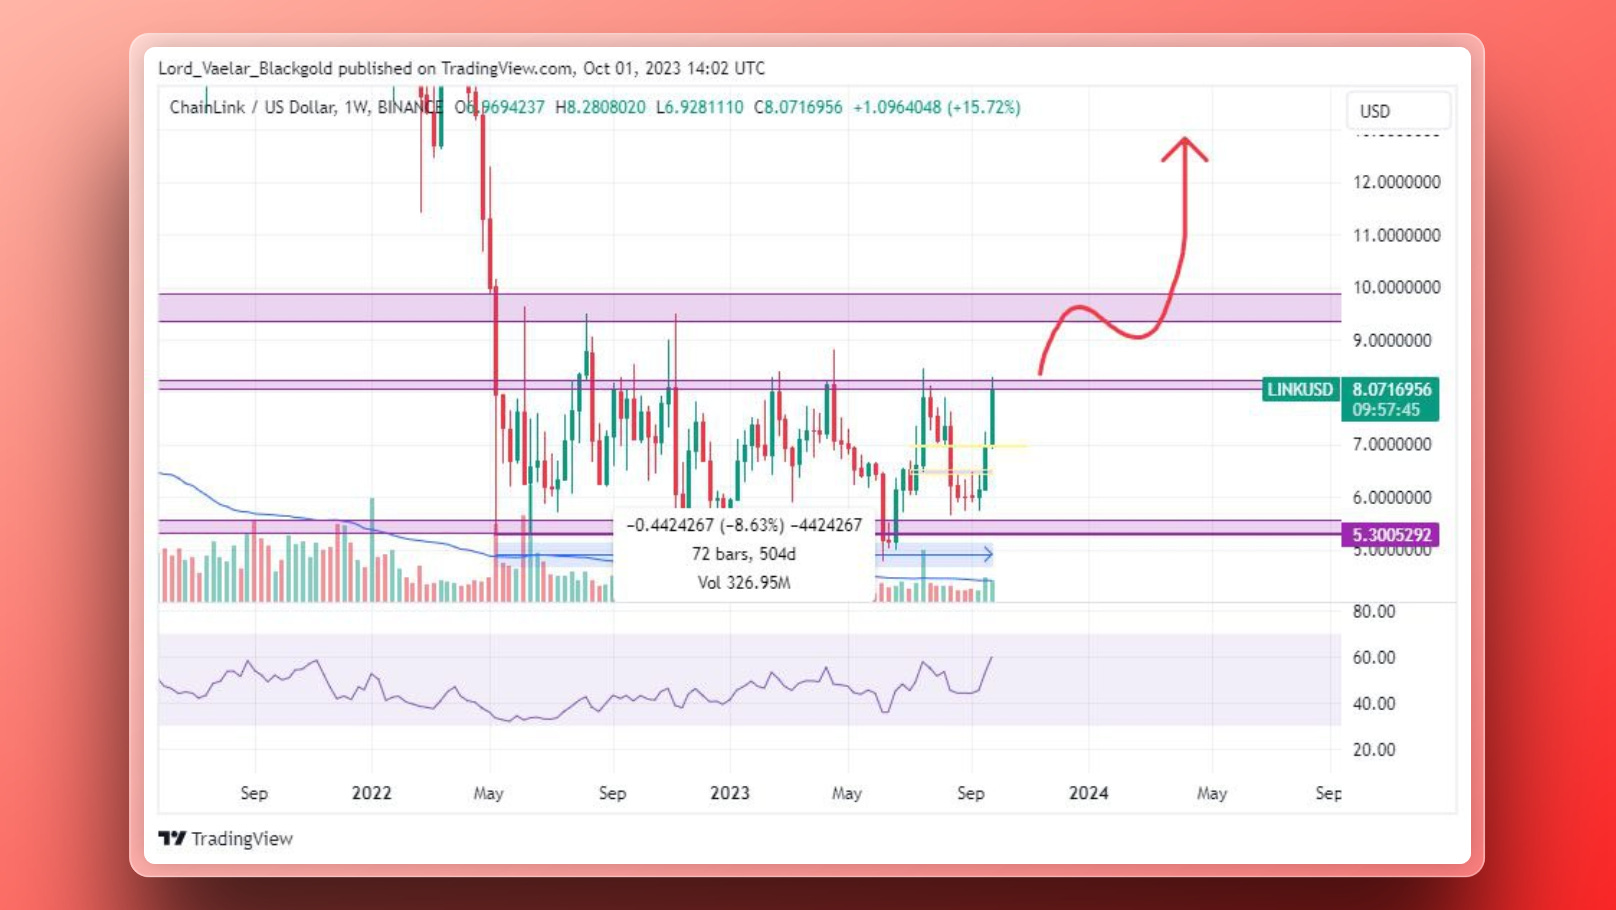
5. LINK
It is one of the best chart showing longest accumulation, on the breakout we can see price surge by 55%
In the daily chart:
Resistance : 8.07-8.22
Support: 7.29-7.38
Disclaimer :
For reference and education only. Not financial advice. Trade responsibly with risk management measures.